Capitalizing on Shifting Global Trends


I made some big changes to my portfolio this month. Most notably, I added a new investment to the mix. My investment model is now taking on more risk after a period of caution. For the past three months, most of my portfolio was in short-term U.S. government bills, which are similar to holding cash. This allowed me to collect a solid dividend of 4.13 percent while waiting for market conditions to improve.
This newsletter shares my personal investing approach and is for informational purposes only. I am not a financial advisor. Please do your own research or consult with a professional before making any investment decisions.

This will be a longer post. I will recap the market and how my portfolio performed, explore recent news that moved the markets, explain why and how I am updating my portfolio strategy by adding a Eurozone fund, and review portfolio allocations going into June.
Market & Portfolio Recap
A brief review of asset and portfolio performance in May and year-to-date for 2025.
Major Asset Class Performance in May
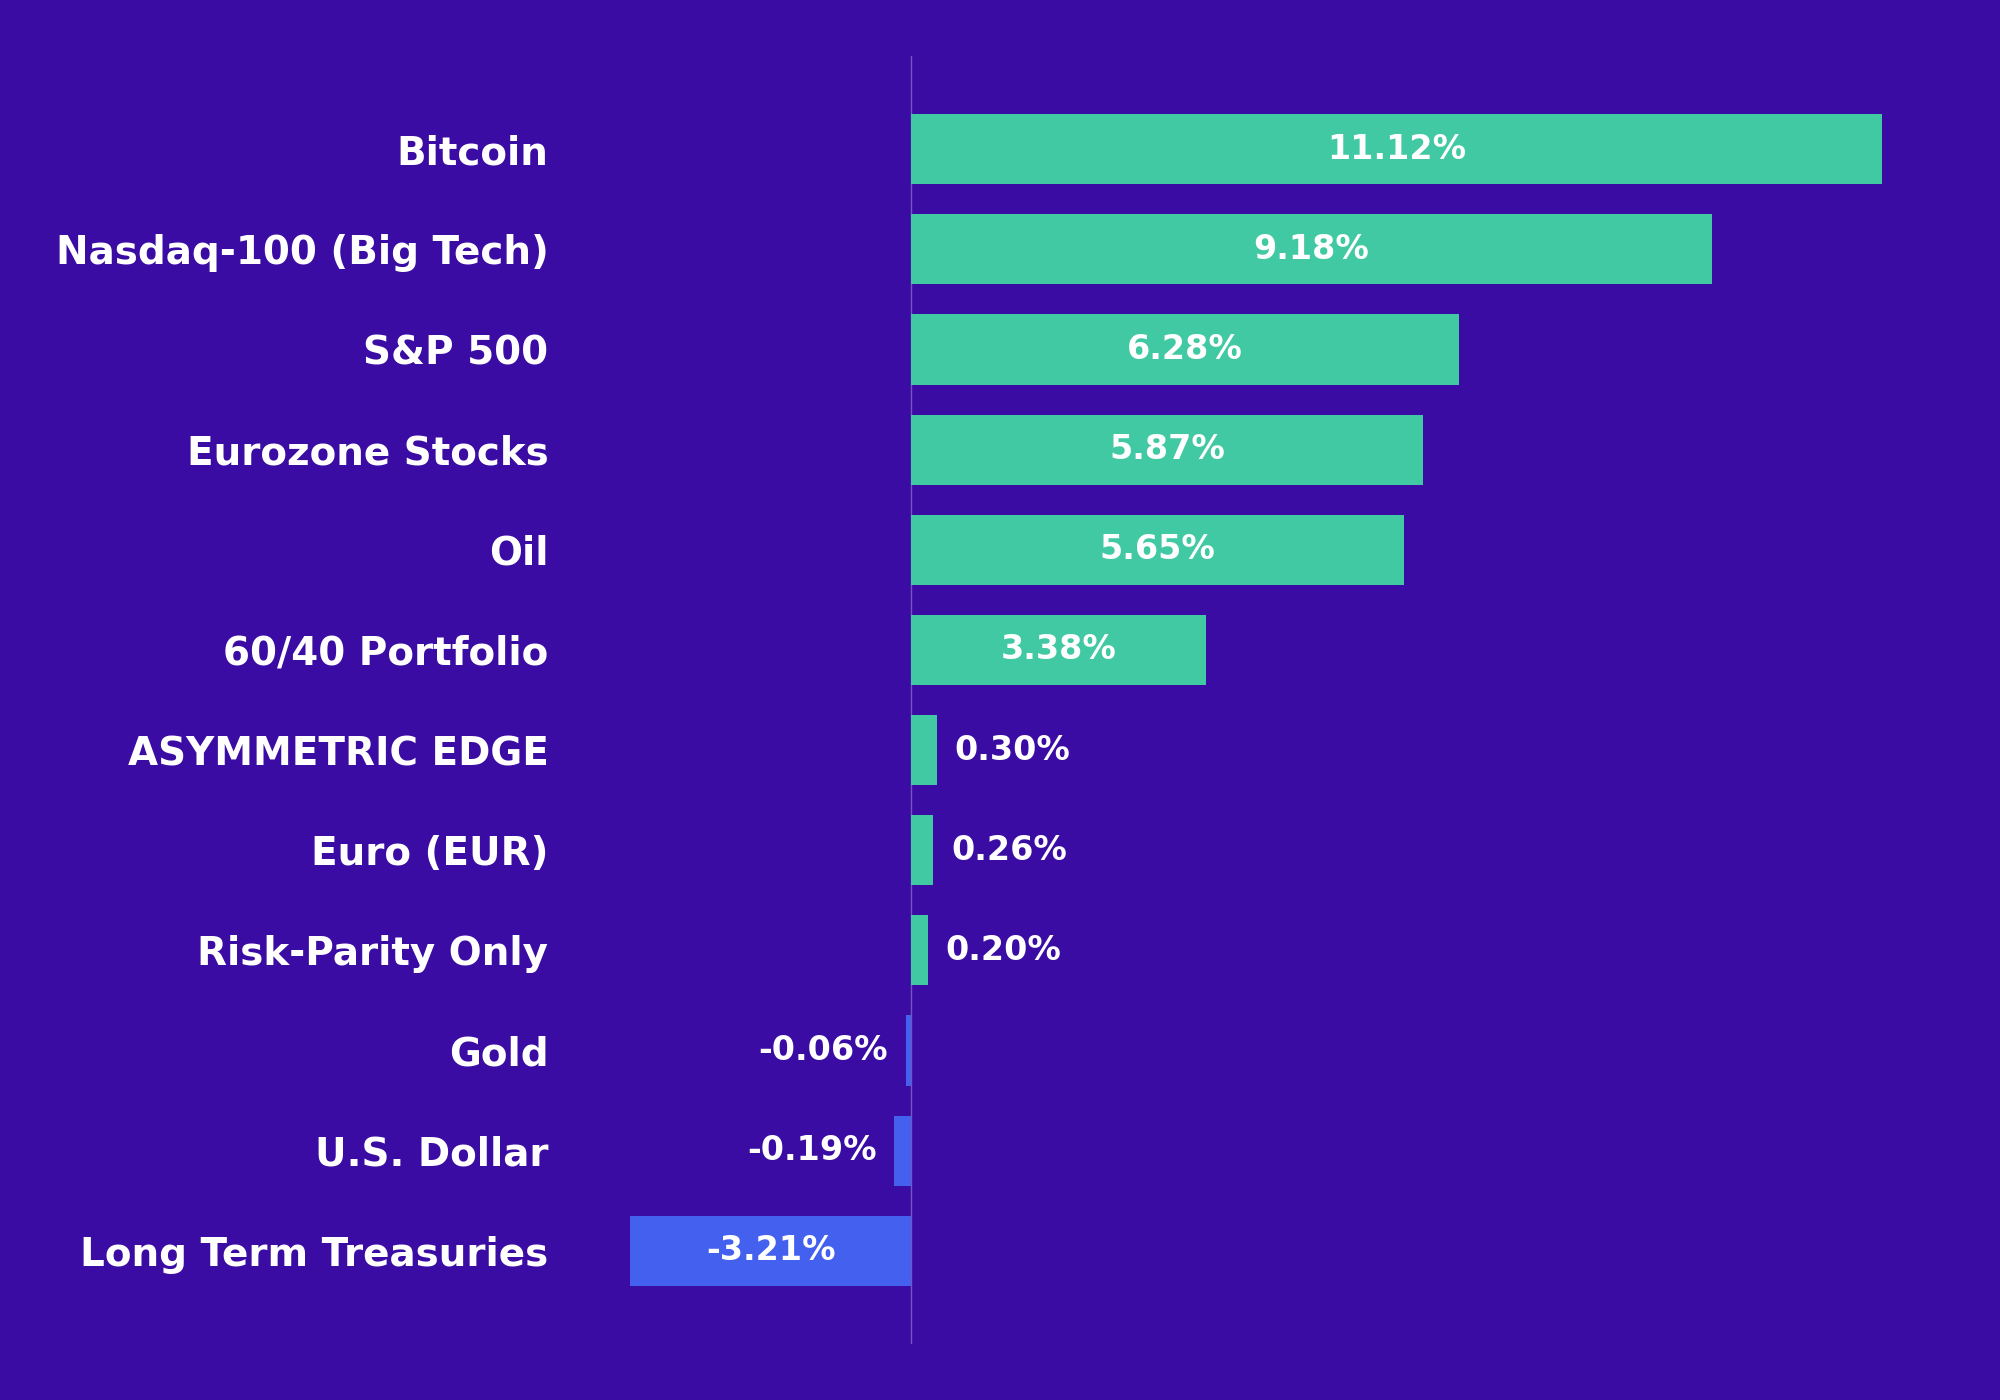
In May, stocks made a strong comeback and recovered more than they lost in April. The Asymmetric Edge Portfolio eked out a 0.3 percent return. This was expected, given that much of my portfolio was held in short-term government bills, which work much like cash.
Major Asset Class Performance in 2025
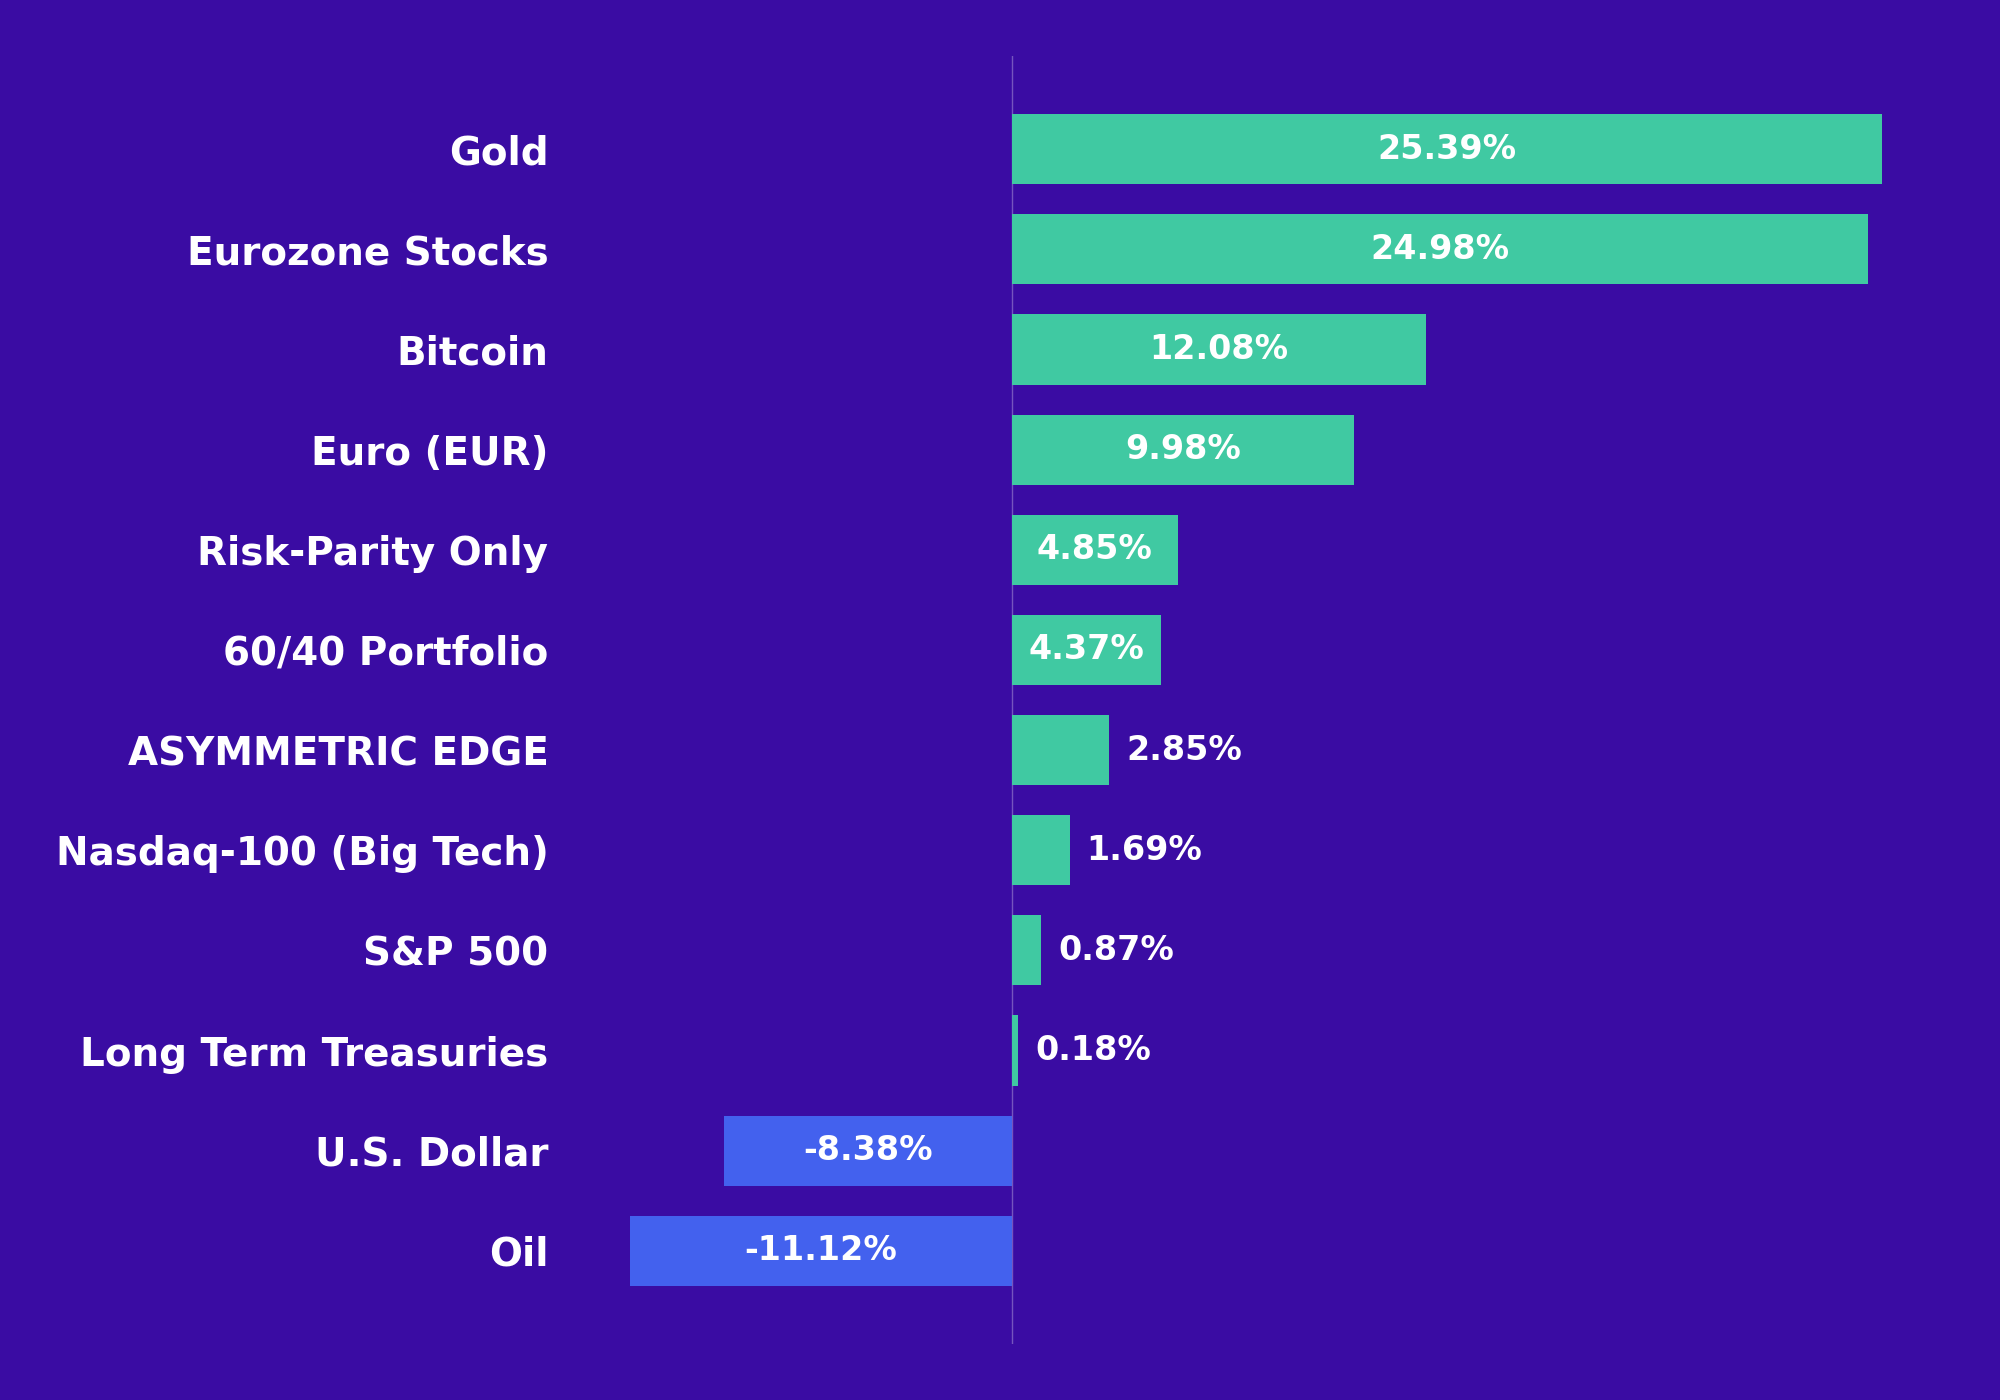
May’s stock market gains more than made up for the declines in April. However, the S&P 500 is still flat for the year.
The Asymmetric Edge Portfolio has returned 2.85 percent so far in 2025, which compares well to other major benchmarks. The S&P 500 is up 1.69 percent and the Nasdaq-100 is up 0.87 percent. A traditional 60/40 portfolio, comprised of 60 percent stocks and 40 percent bonds, returned 4.37 percent this year, with outperformance largely due to international holdings in the specific 60/40 exchange-traded fund (ETF) I track (see iShares Core 60/40 Balanced Allocation ETF).
Eurozone stocks, in particular, have performed very well this year. In fact, most markets outside the United States have done better so far in 2025.
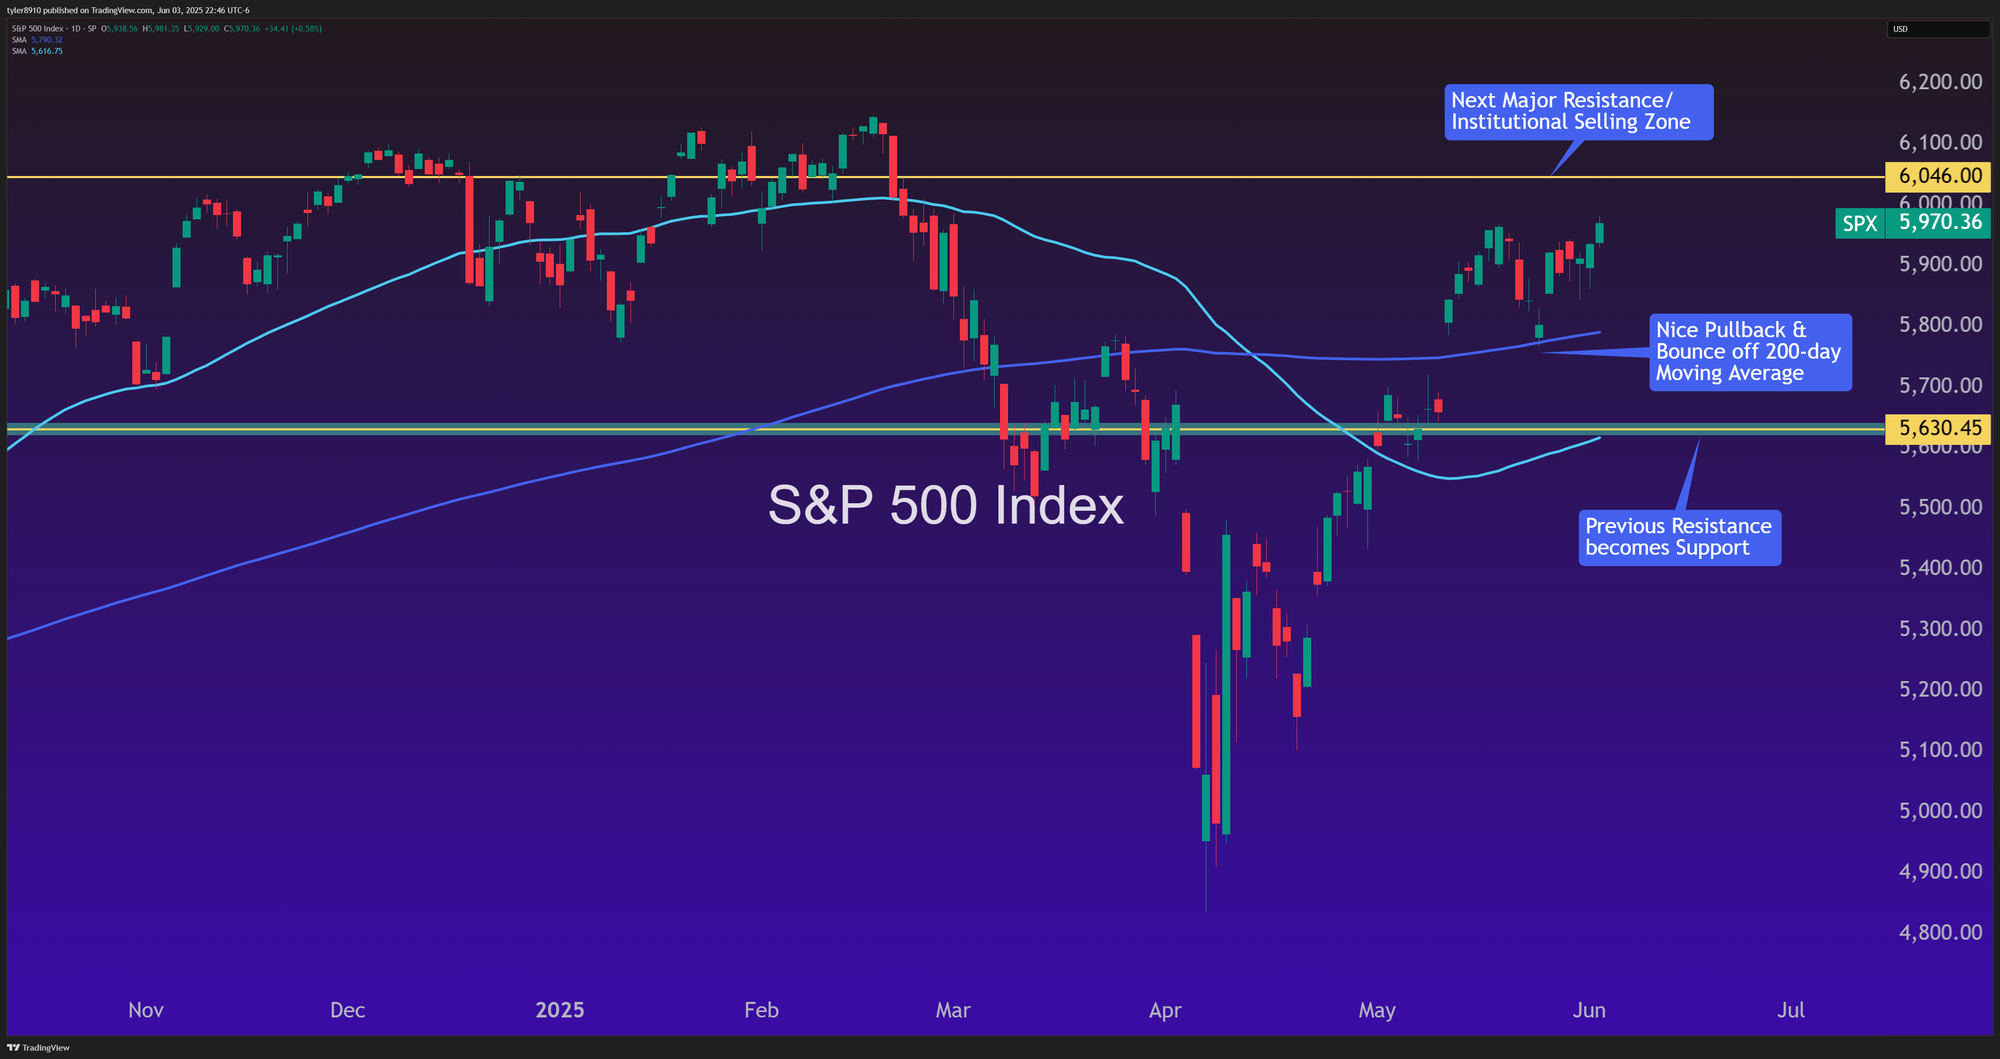
S&P 500 Chart Update
I often mention the S&P 500, even though it is not included in my Asymmetric Edge strategy. This is because it is the most widely watched stock index in the world and represents about 64 percent of the global stock market.
Technical analysis is a way of studying price charts and patterns in an effort to predict how markets might move in the future. While I sometimes look at technical analysis, I do not use it as part of my rules-based, adaptive momentum model. My investment decisions come from a consistent process that focuses on how different parts of the market have been performing. I only use technical analysis to get a general sense of where the market might be heading, not to decide what to buy or sell.
At the start of May, I took a cautious view and thought the S&P 500 might struggle to go much higher than 5,600. At that time, the odds seemed to favor a decline. However, the index moved above several important levels, including the 200-day moving average and an area where large investors often sell. The next important level I’m watching is around 6,050, which I think could be a tougher barrier for the index to get past.
These are simply reference points that I personally track to understand how markets move. Based on past experience, I might expect the market to chop around in this range during June. This month is usually quieter than others, so I do not expect big moves.
At the moment, none of my technical indicators are giving strong signals in either direction. It is also worth mentioning that, while the S&P 500 still faces significant overhead resistance, the Nasdaq-100 and Eurozone markets are better positioned for further upside.
All commentary reflects my personal observations and should not be taken as investment advice.
News That Moved Markets
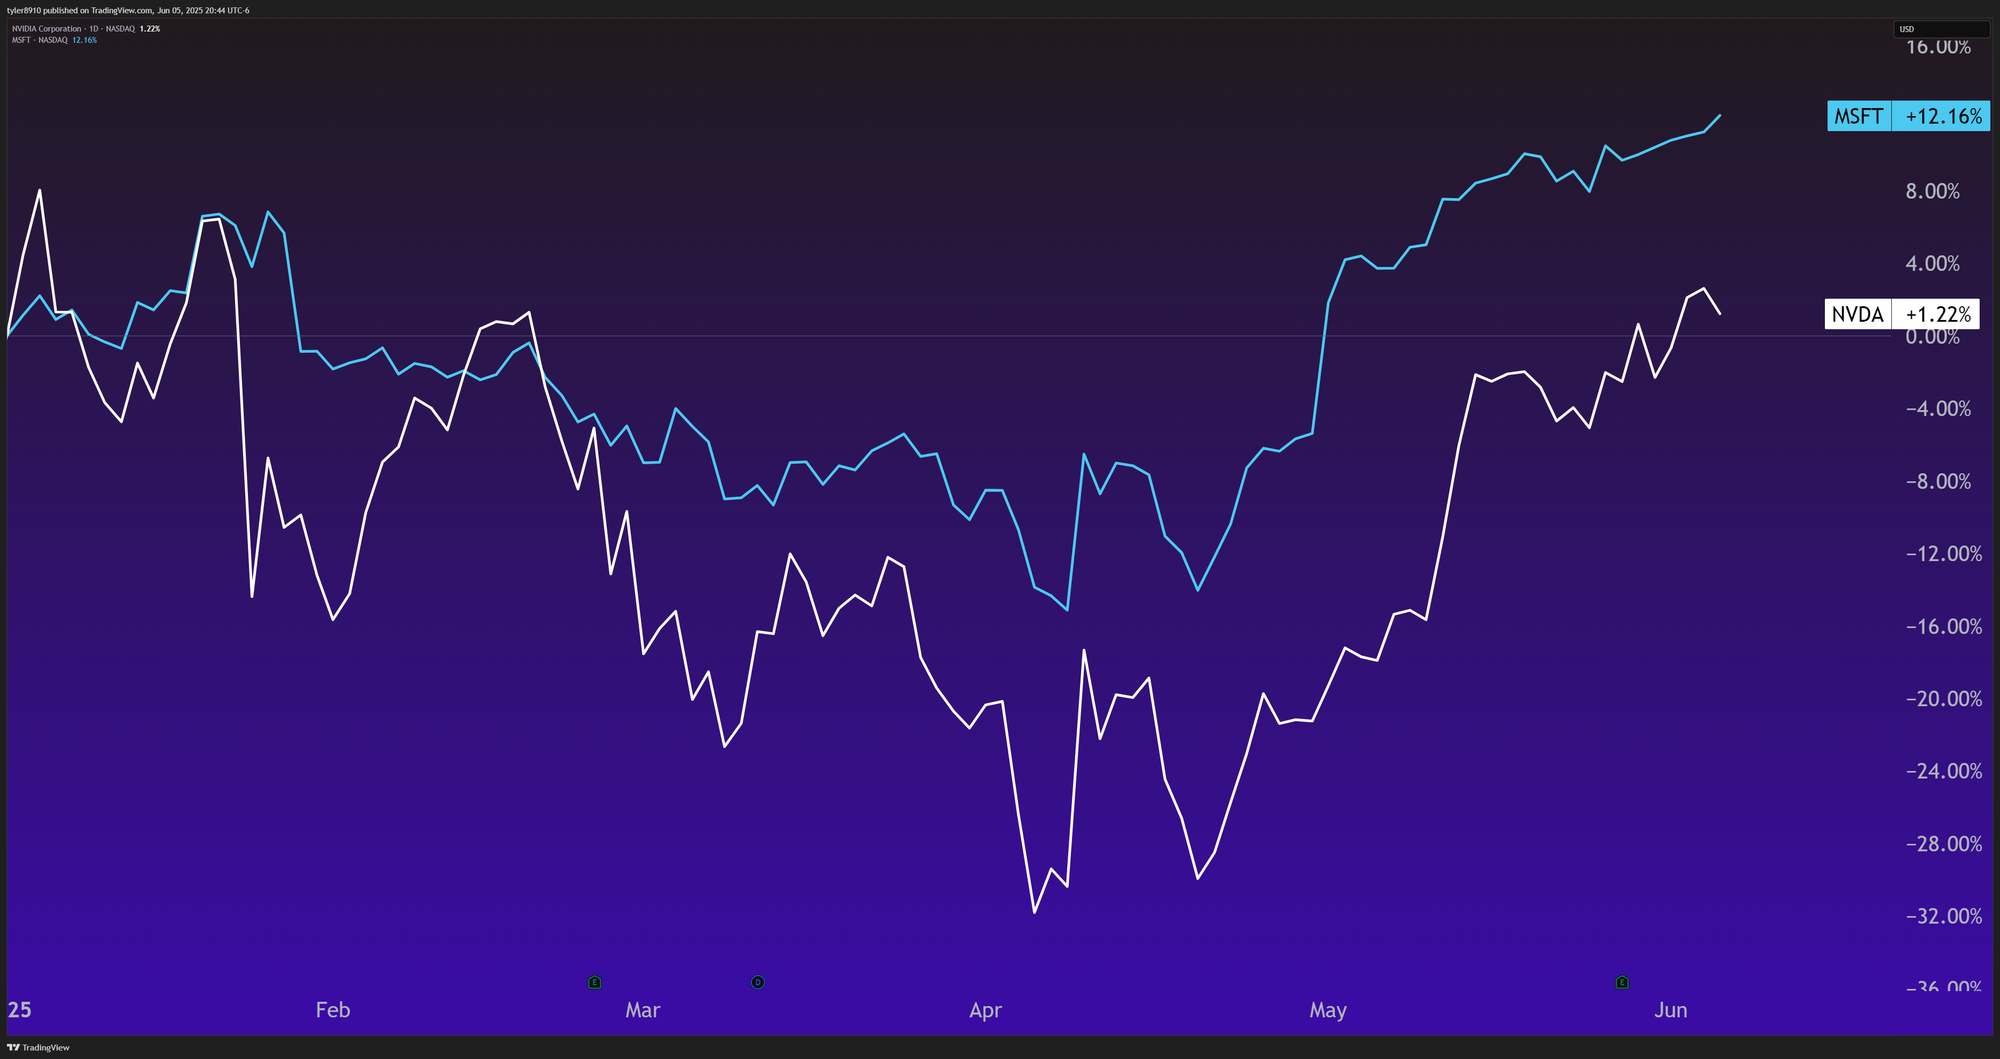
United States stock markets rose as investors hoped for lower tariffs between the United States and China and saw signs of moderating inflation. Strong earnings and continued investment in artificial intelligence by companies like Nvidia and Microsoft pushed the Nasdaq-100 higher. Smaller companies, which are represented by the Russell 2000 index, rose only slightly. These smaller businesses are more affected by rising costs and trade uncertainties than the largest technology firms.
European stocks have had a very strong year. In May, a pause in U.S auto tariffs and a continued surge in defense stocks, driven by rising geopolitical tensions, were key factors. Eurozone stocks were also helped by lower expected interest rates from the European Central Bank and impressive economic growth in Germany.
United States Treasury bonds, especially long-term ones like 30-year Treasuries, continue to underperform. Fewer investors are willing to buy government bonds, which makes it more expensive for the government to borrow money. This is happening at a time when the national debt is already very high.
In currency markets, the United States dollar stabilized after falling to a six-week low against the euro. The dollar is still under pressure because of large government deficits, while the euro has gained strength from falling inflation and the expectation of lower interest rates.
Gold continued its ascent, maintaining its centuries-old role as a safe haven in uncertain times. Central banks, especially in Asia, have been buying gold, and ongoing global conflicts have kept demand high. Meanwhile, institutional buying and the idea of Bitcoin as “digital gold” pushed Bitcoin to new highs, briefly reaching 112,000 dollars.
Strategy Update

It is unusual for me to make changes to the basket of assets my strategy selects from. The Nasdaq-100, Russell 2000, long-term United States Treasury bonds, Bitcoin, gold, oil, a beta arbitrage fund, Treasury bills, and copper miners have been the core components for well over a year. Each asset class plays a specific role in the strategy, interacting with the others in a way that works well with my trend-following model. Changing even one part of this group means running countless backtests and stress tests to make sure the change is robust.
However, sometimes change is necessary. Many investment strategies fail because they do not adapt when markets shift, and markets are always changing.
The Strategy is Overexposed to the U.S. Dollar
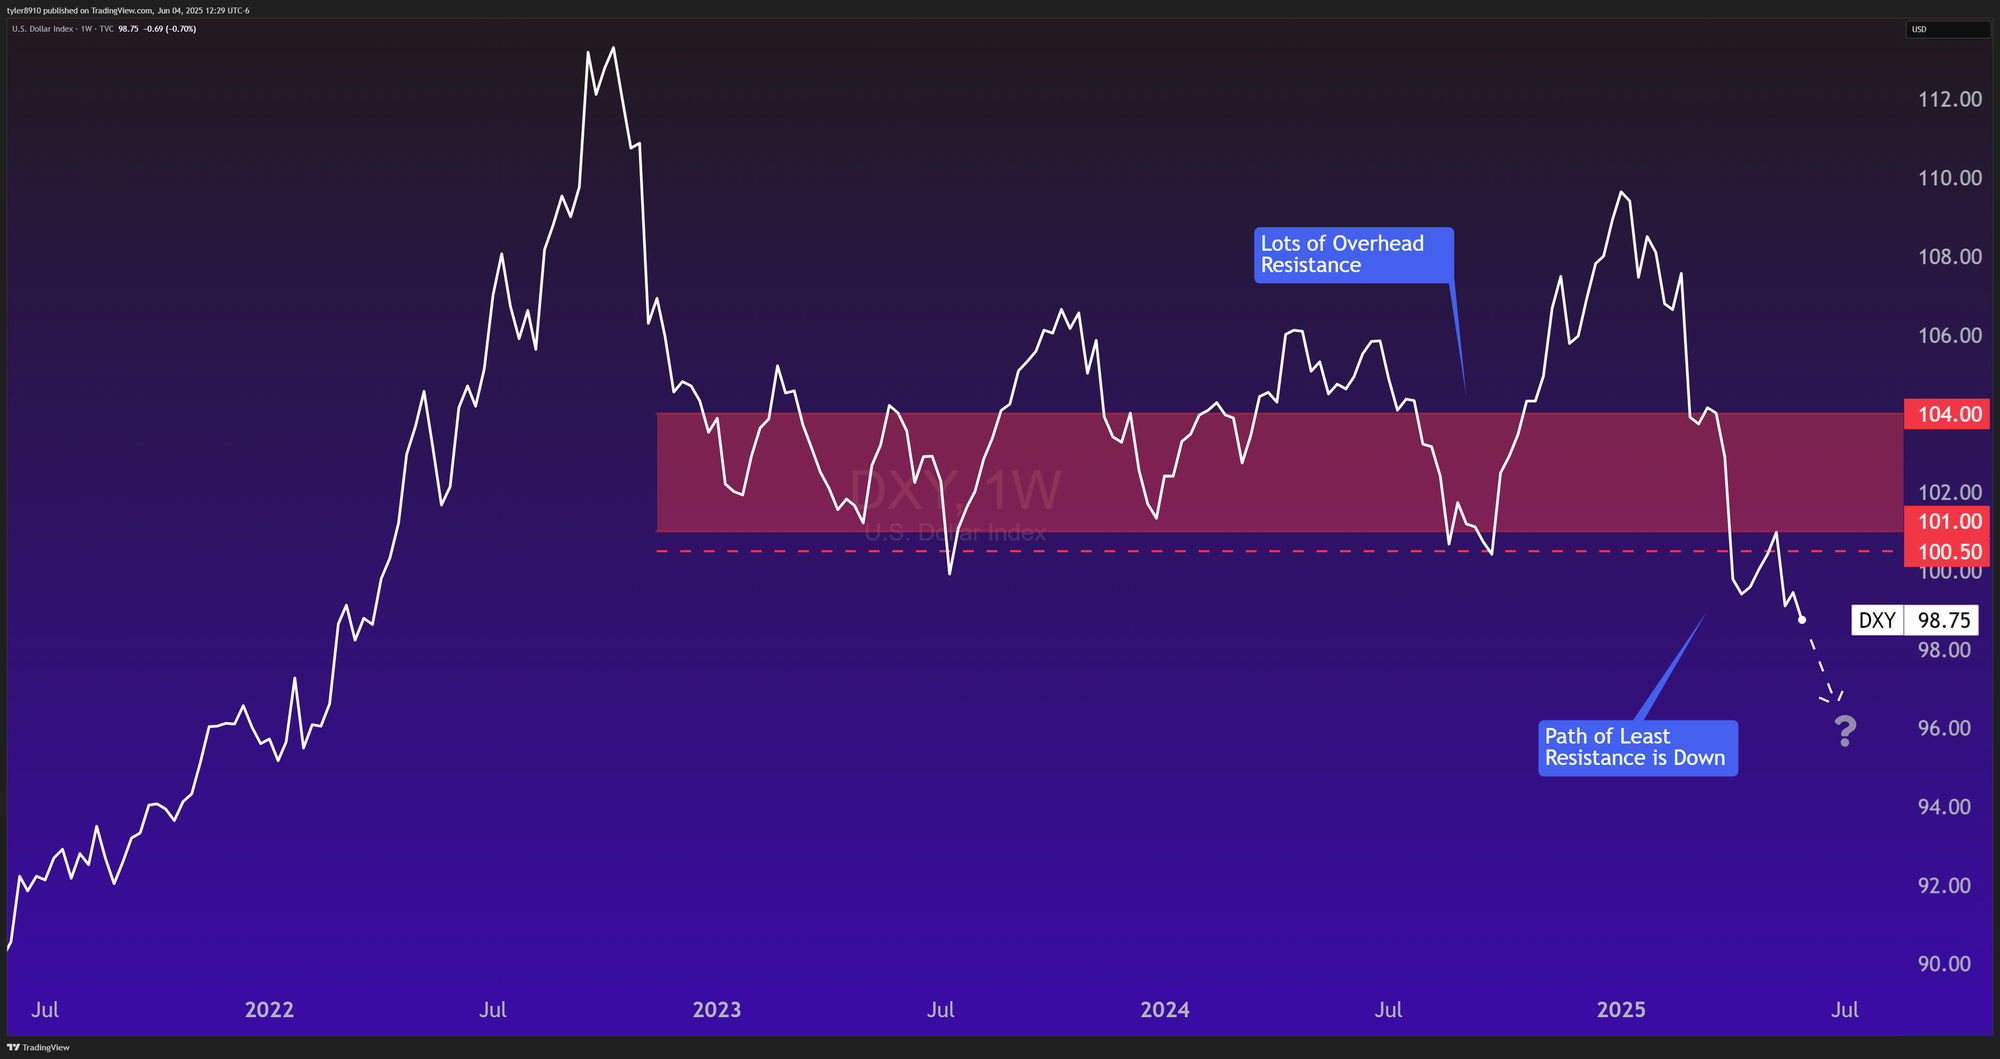
Lately, the United States dollar has been weak, and U.S. stock markets haven't performed well. While this is not alarming by itself, I never want to be overly exposed to any single risk. This year, I noticed a possible weakness in my approach.
When my model turns cautious, Treasury bills often make up most of my portfolio. From March through May, these cash-like, very stable investments were among the top four performers, and few other assets did better. The main stock indexes in my strategy—the Russell 2000 and the Nasdaq-100—have also underperformed this year. Because my investment model determines asset allocation based on volatility (less volatility means a greater allocation), Treasury bills sometimes made up more than 90 percent of my portfolio.
Having a large allocation to Treasury bills increased my own exposure to shifts in the U.S. dollar. Since account balances are shown in dollars, it can be easy to overlook this type of risk. To balance things out in my portfolio, I chose to add an asset that I thought could potentially help if the dollar remains weak.
Possible reasons for the dollar’s decline include concerns about its status as the world’s reserve currency, government deficits, and stated policy goals to make the dollar weaker.
The Euro is Showing Strength
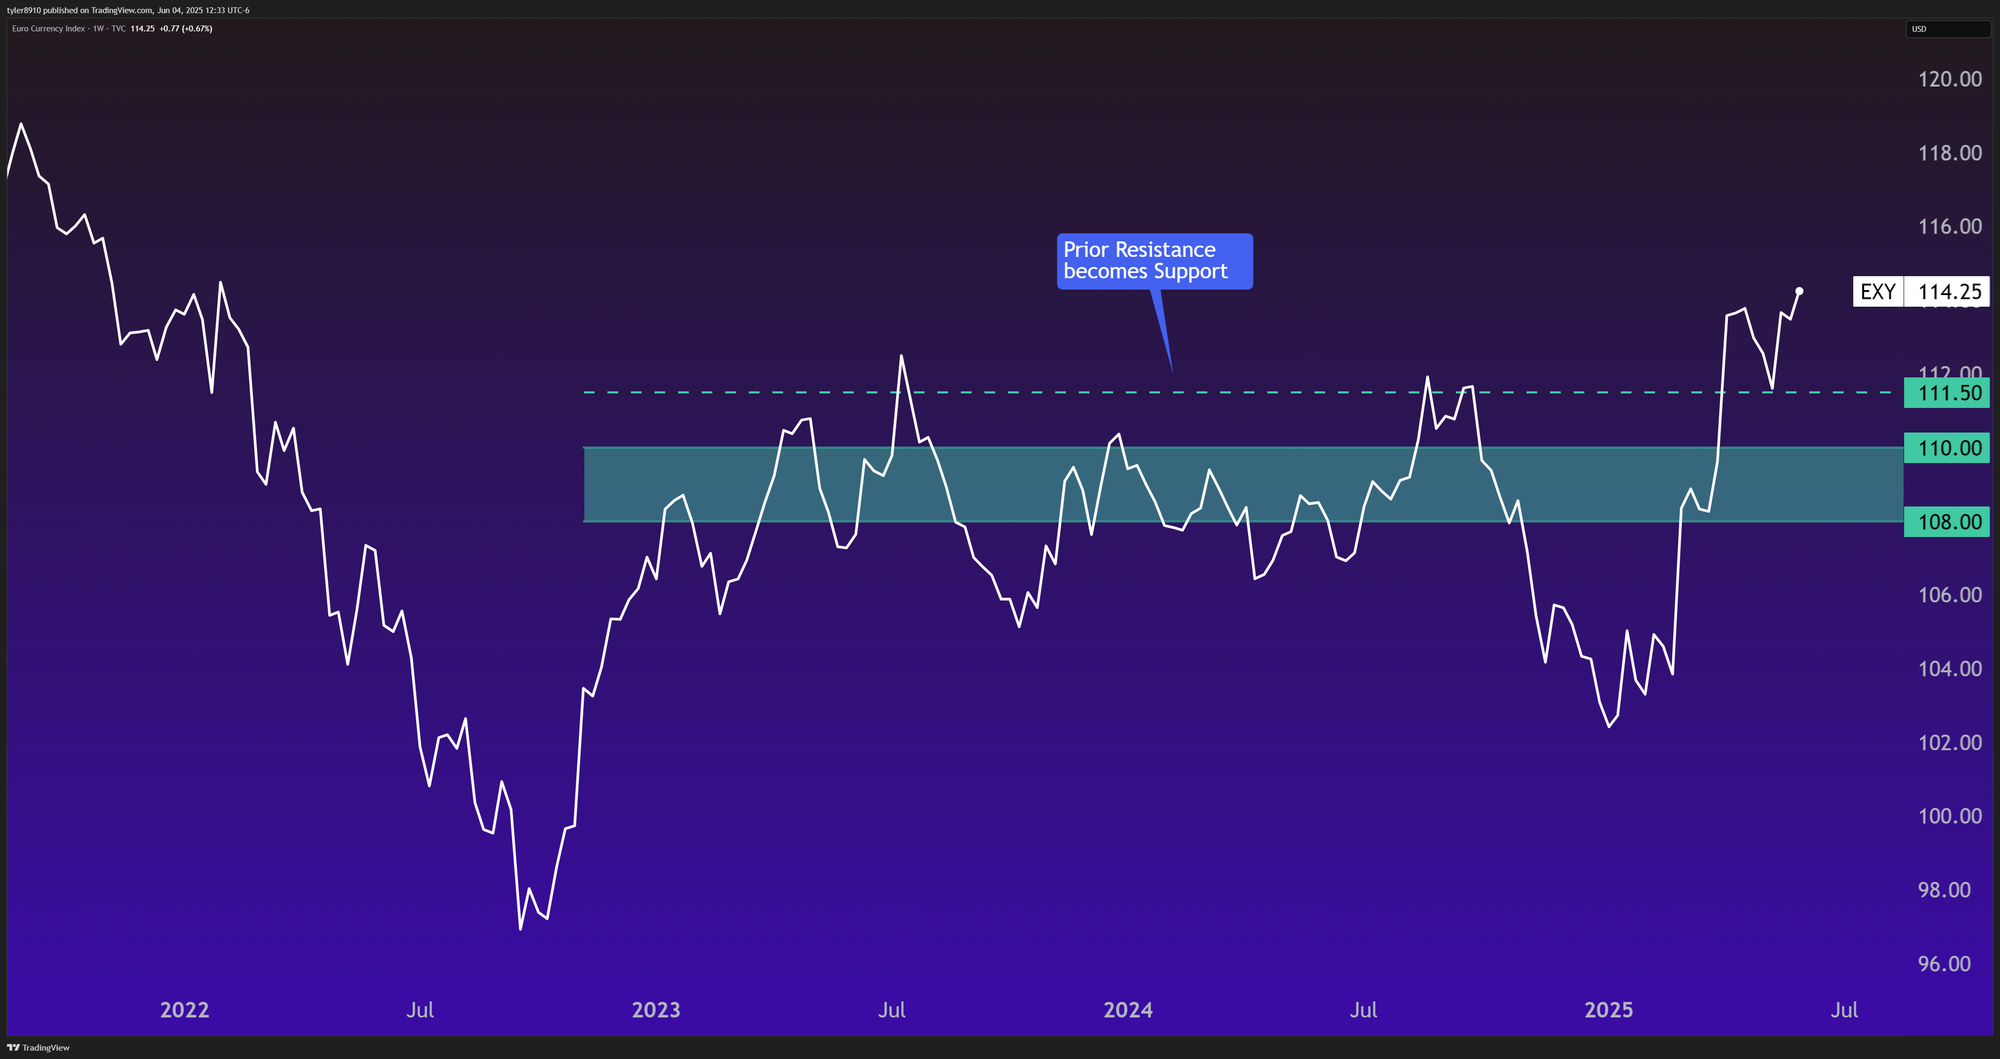
The strength of a country’s stock market and its currency often move together. When United States stocks are strong, the dollar usually is too. This year the opposite has been the case, and most major markets and currencies outside the United States have performed much better.
Eurozone Stocks are on Fire
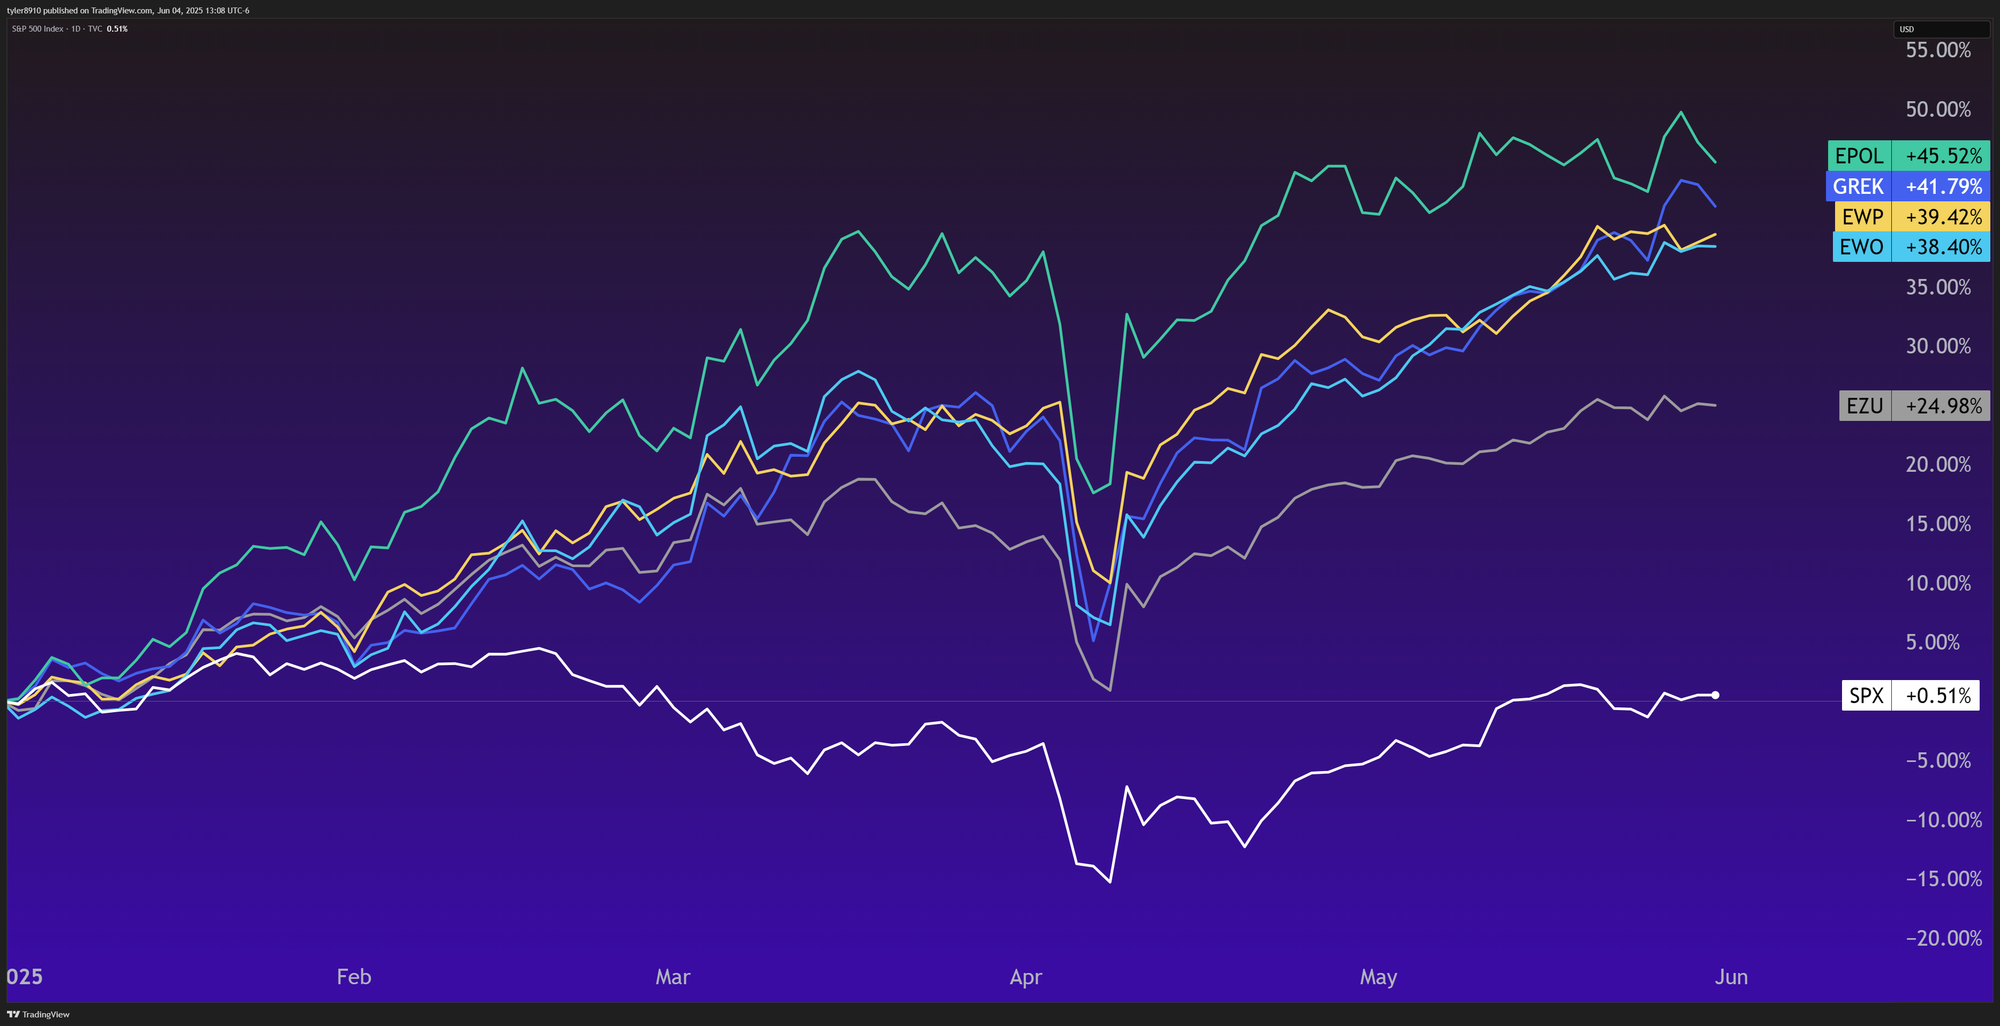
Eurozone stocks have outperformed the S&P 500 by 25 percent so far this year. Some countries in Europe, like Poland, Greece, Austria, and Spain, have outperformed the U.S. by even wider margins.
Currencies Can Trend for a Decade
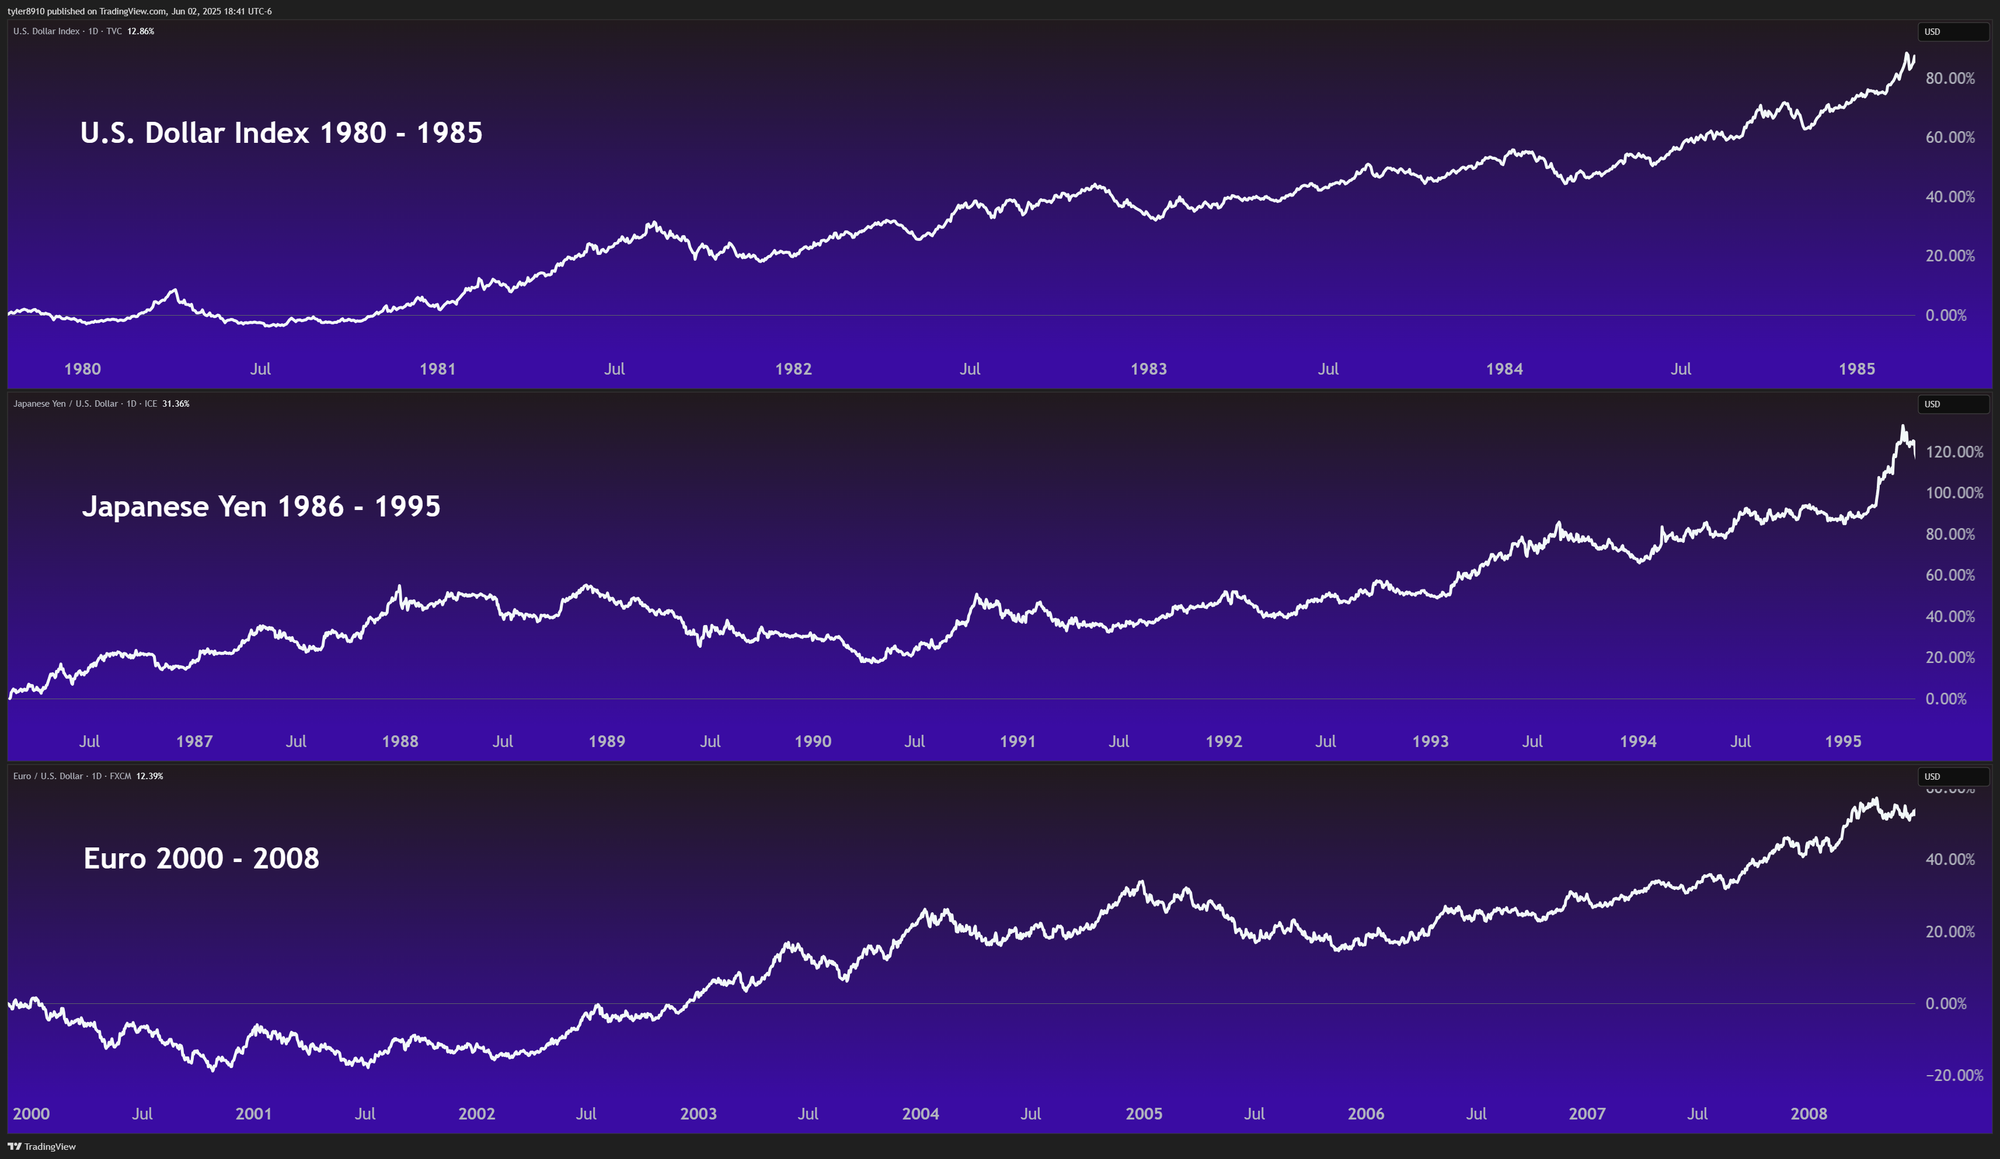
Currencies often trend for long periods. For example, the dollar was strong from 1980 to 1985, the Japanese yen rose steadily from 1986 to 1995, and the euro had a long period of strength from 2000 to 2008. In momentum investing, it is hard to know in advance which trends will persist. This is why it is important to have clear rules for entering and exiting potential trends. While some attempts will not work out, the aim is to capture the strongest and longest-lasting moves.
I considered adding a fund that holds euros and pays interest, but this would mean making a concentrated bet on the euro. I also looked at funds that hold short-term international government bonds, but these also tend to behave like the euro. These options would still leave my portfolio overly exposed to a single currency.
My Solution to U.S. Dollar Overexposure
I decided to add a Eurozone ETF, specifically the iShares MSCI Eurozone ETF, which goes by the ticker EZU. This fund holds stocks of large and medium-sized companies from countries that use the euro as their currency. It provides exposure to both the euro and to European stock market performance. Because it is a stock fund, it is more volatile, so my strategy model assigns it a much smaller allocation to balance the risk. This is important because, unlike Treasury bills earlier in the year, this ETF will not take over the portfolio. Instead, when it's trending well, it will typically receive a modest allocation—20 percent, for instance—which keeps my portfolio more balanced. As always, this is just my approach—others may have very different needs or preferences.
Momentum is at the core of my strategy, so I need access to the best-performing equity markets. EZU helps provide this access.
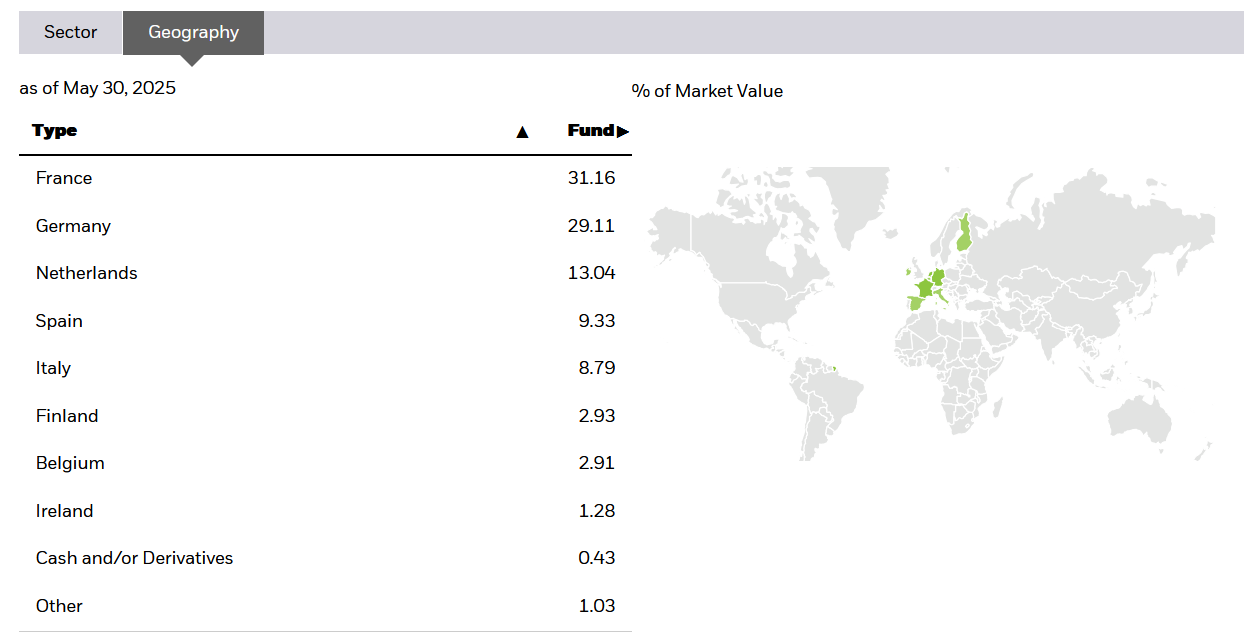
Adding this fund means my portfolio is not too exposed to any one currency or country. For example, the fund is made up of companies from several European countries, with France making up about 31 percent, Germany 29 percent, and the Netherlands 13 percent.
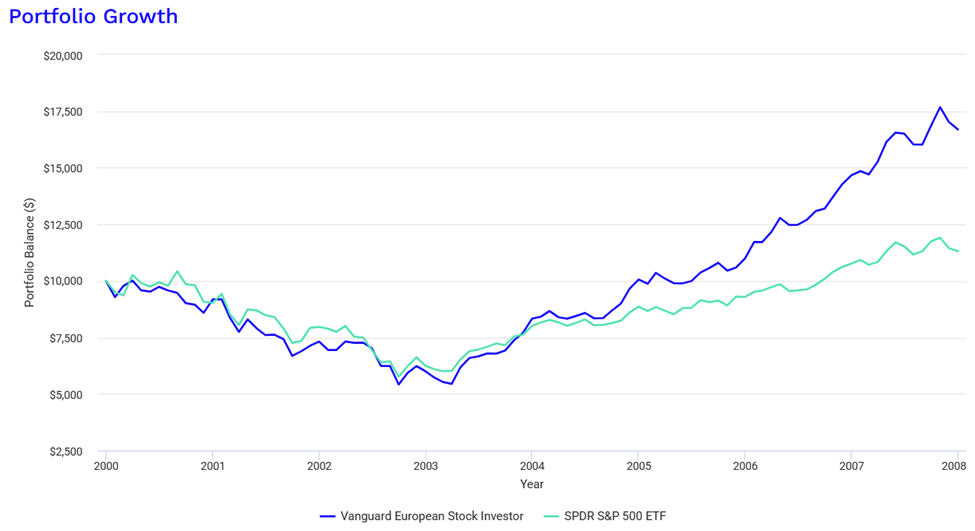
Different markets tend to outperform at different times, and these periods can last for several years. For example, from 2003 to 2008, European stocks did much better than the S&P 500.
In case you are wondering why I am not considering emerging markets, there are a few reasons. Most emerging market funds, such as EEM, are heavily concentrated in China and Taiwan. With the current geopolitical risks in that region, I am not comfortable investing there. I prefer Europe for its well-established markets and strong rule of law.
All examples and allocations mentioned are part of my own portfolio process and are not recommendations. Please consider your own circumstances and consult with a professional if needed.
June's Portfolio Rotation
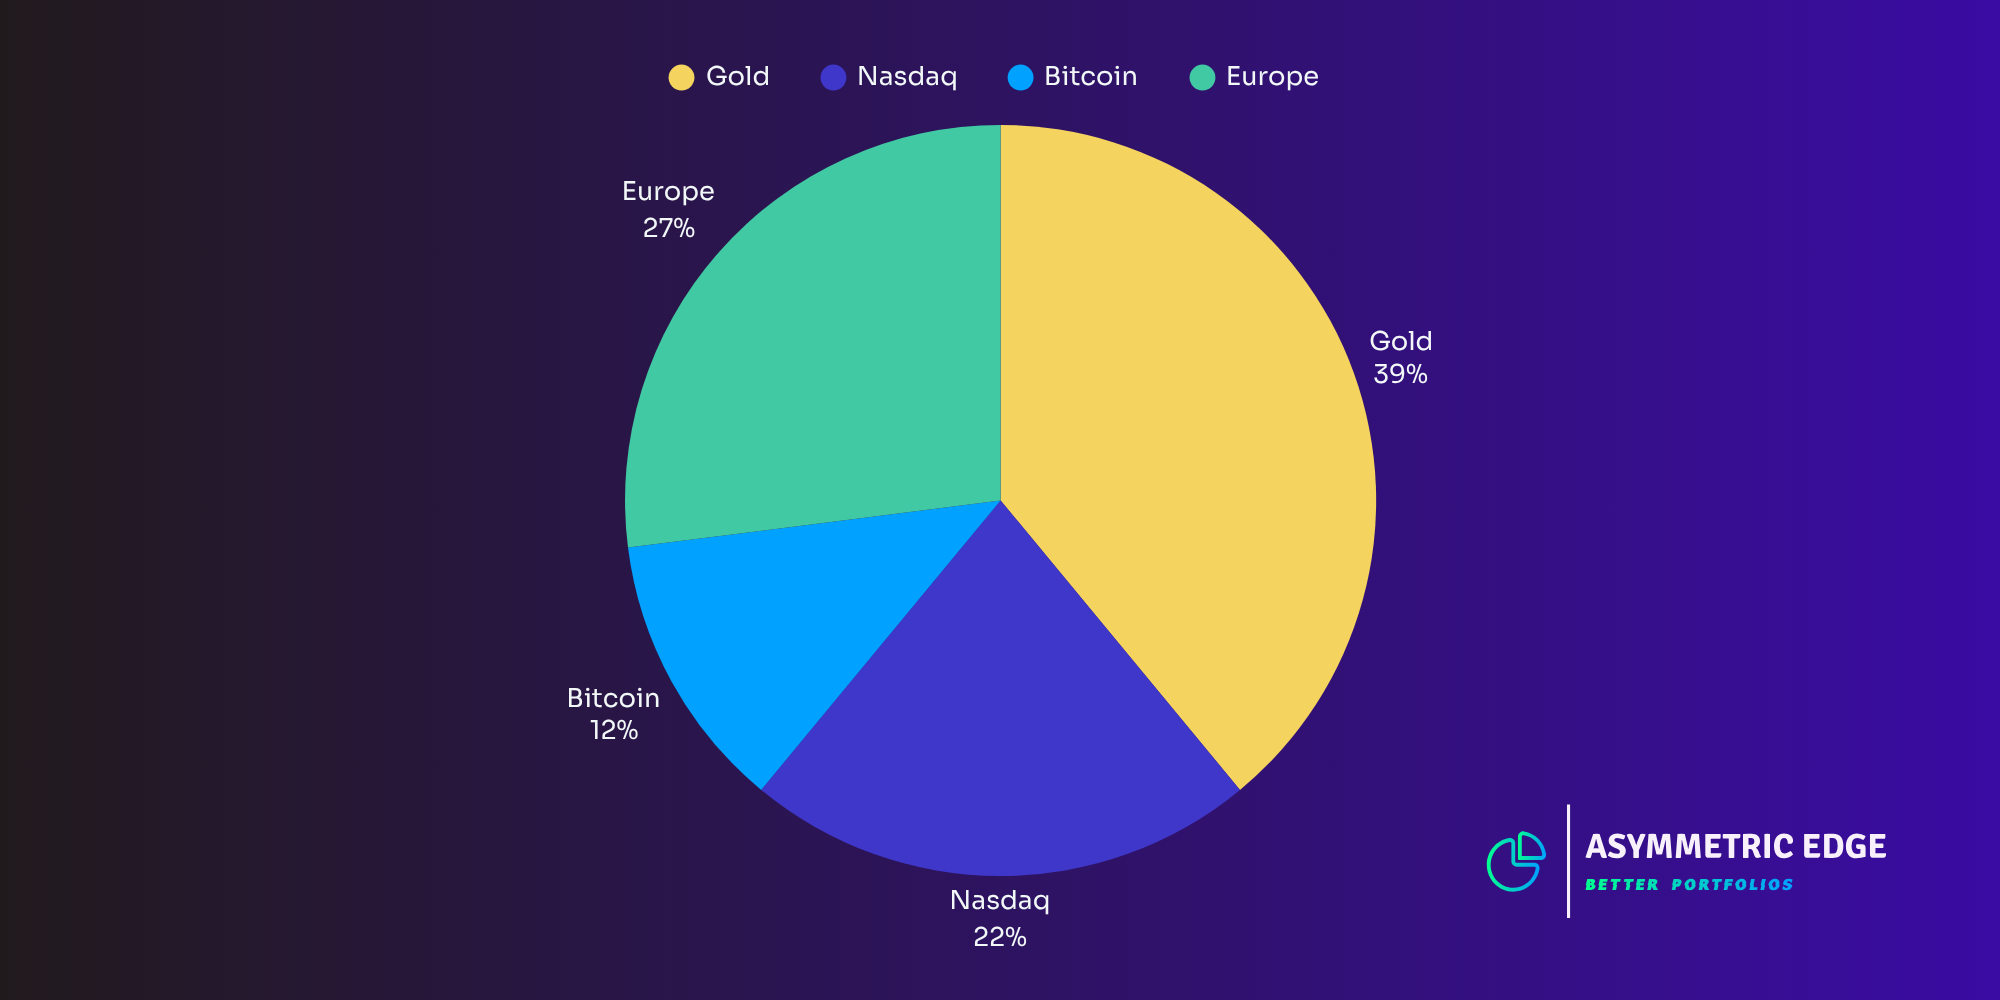
This month, I made significant changes to my portfolio by moving out of Treasury bills and reallocating capital across a range of assets:
- GLD (Gold): 39.44%
- EZU (Eurozone): 26.6%
- QQQ (Nasdaq-100): 21.87%
- IBIT (Bitcoin): 12.09%
(Again, these are just my allocations, shared for informational purposes—not as recommendations.)
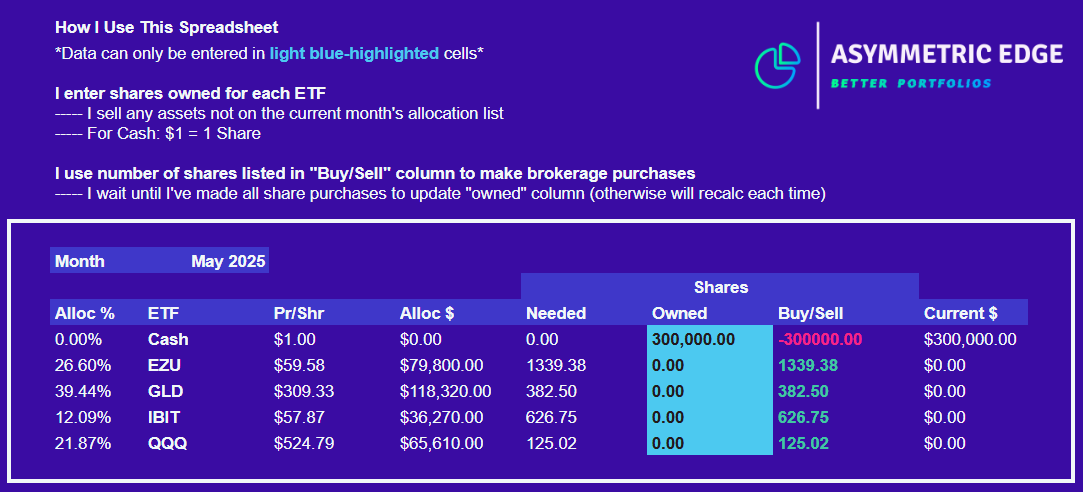
Purchasing Shares
Here's a link to the Google Sheet I use to rebalance my portfolio. The spreadsheet pulls live ETF prices and helps me calculate how many shares to buy or sell based on the data provided.
Calculator Terms of Use
This tool is provided for informational purposes only. While I strive to ensure accuracy, I make no representation or warranty as to its accuracy or completeness. Users should verify all calculations independently.
I am happy to be back in stocks, with about 48 percent of my portfolio now in equities. Although my portfolio is in what I would call a risk-on position, nearly 40 percent remains in gold. Many investors see gold as a conservative choice, especially since it can act as a hedge during uncertain or volatile markets.
One Final Chart
The power of allocating just 2% of a portfolio to Bitcoin
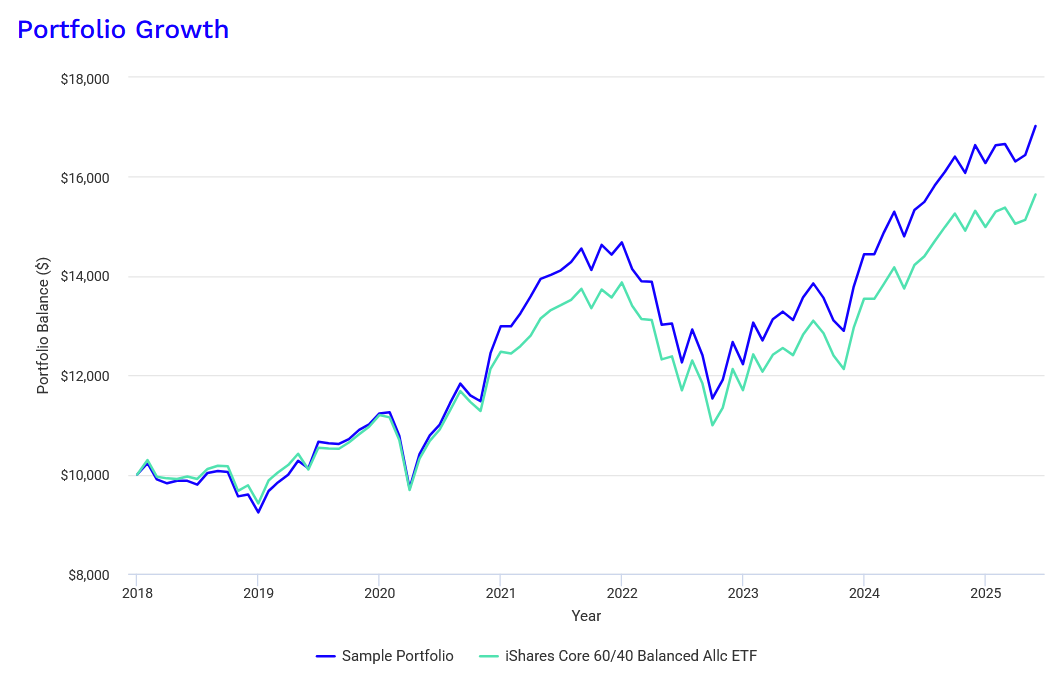
Crypto can be intimidating for many people. I remember feeling skeptical about it at first. There is no single definition of Bitcoin. Some people think of it as digital gold. Others see it as a type of money that does not rely on banks or governments. Some view it as a way to protect themselves from financial crises, especially in places where the financial system is weak.
As an example of how much difference adding Bitcoin to a portfolio can make, consider this: if someone had allocated just 2 percent of a typical balanced (60/40) portfolio to Bitcoin at the start of 2018—a particularly challenging time to enter the crypto market, since prices were declining throughout much of that year—the results by May 2025 would likely be surprising.
Despite the tough timing, this small allocation to Bitcoin would have increased this portfolio’s average annual return by almost 20 percent, raising it from 6.22 percent to 7.44 percent, with only a slight increase in maximum drawdown (up just 0.68%). This illustrates the kind of asymmetric opportunities I look for, where the potential downside is limited but the upside can be significant.
What matters most to me is that Bitcoin seems to be here to stay. Big organizations are buying in, and new, more friendly regulations are being put in place. Even more important is that Bitcoin continues to trend well for long periods, which is a crucial ingredient in successful momentum investing.
This newsletter is for informational purposes only and should not be considered as investment advice or a recommendation of any particular security, strategy, or investment product. The information contained herein has been obtained from sources believed to be reliable, but its accuracy and completeness are not guaranteed. Opinions expressed are subject to change without notice. This material is not an offer to sell or a solicitation of an offer to buy any security.
The author may hold positions in securities mentioned in this newsletter. All expressions of opinion are subject to change without notice in reaction to shifting market conditions. Data contained herein from third-party providers is obtained from what are considered reliable sources. However, its accuracy, completeness, or reliability cannot be guaranteed.
Investment involves risk, including possible loss of principal. No investment strategy or risk management technique can guarantee returns or eliminate risk in any market environment.