July Market Recap, August Outlook, and Bitcoin Price Targets
In this issue, I cover what moved markets last month, simple methods for evaluating investment strategies, my August outlook, and price targets for Bitcoin, as well as how I arrived at these numbers.


Welcome back!
Before we begin, I want to revisit why I started writing this newsletter. My goal is to make investing clearer and to explain how I manage my own portfolio.
My strategy is more active than traditional buy-and-hold but far less demanding than short-term trading. Each month I select four exchange-traded funds that I believe have strong momentum, balanced risk, and low correlation. In simulated backtests over the past decade, the largest decline was -5.71% compared to the S&P 500’s -23.95%, and the model showed higher returns in that test period. The portfolio went live with actual capital in January 2024, and so far the real-world results have been in line with those simulations. Readers with both growth and retirement goals have shown interest in this strategy.
In this issue, I cover what moved markets last month, simple methods for evaluating investment strategies, my August outlook, and my price targets for Bitcoin, as well as how I arrived at these numbers.

If you'd like to listen to this newsletter, I recommend listening at 1.2x speed.
This newsletter shares my personal investing approach and is for informational purposes only. I am not a financial advisor. Please do your own research or consult with a professional before making any investment decisions.
July Asset Performance & News
Last month, my portfolio included the Nasdaq-100, Eurozone equities, gold, and Bitcoin. July was another example of why it helps to own a range of assets that often behave differently. Bitcoin and the Nasdaq-100 both rose, balancing out small losses in gold and Eurozone equities. As a result, the portfolio finished July with a small gain.
July Asset Returns
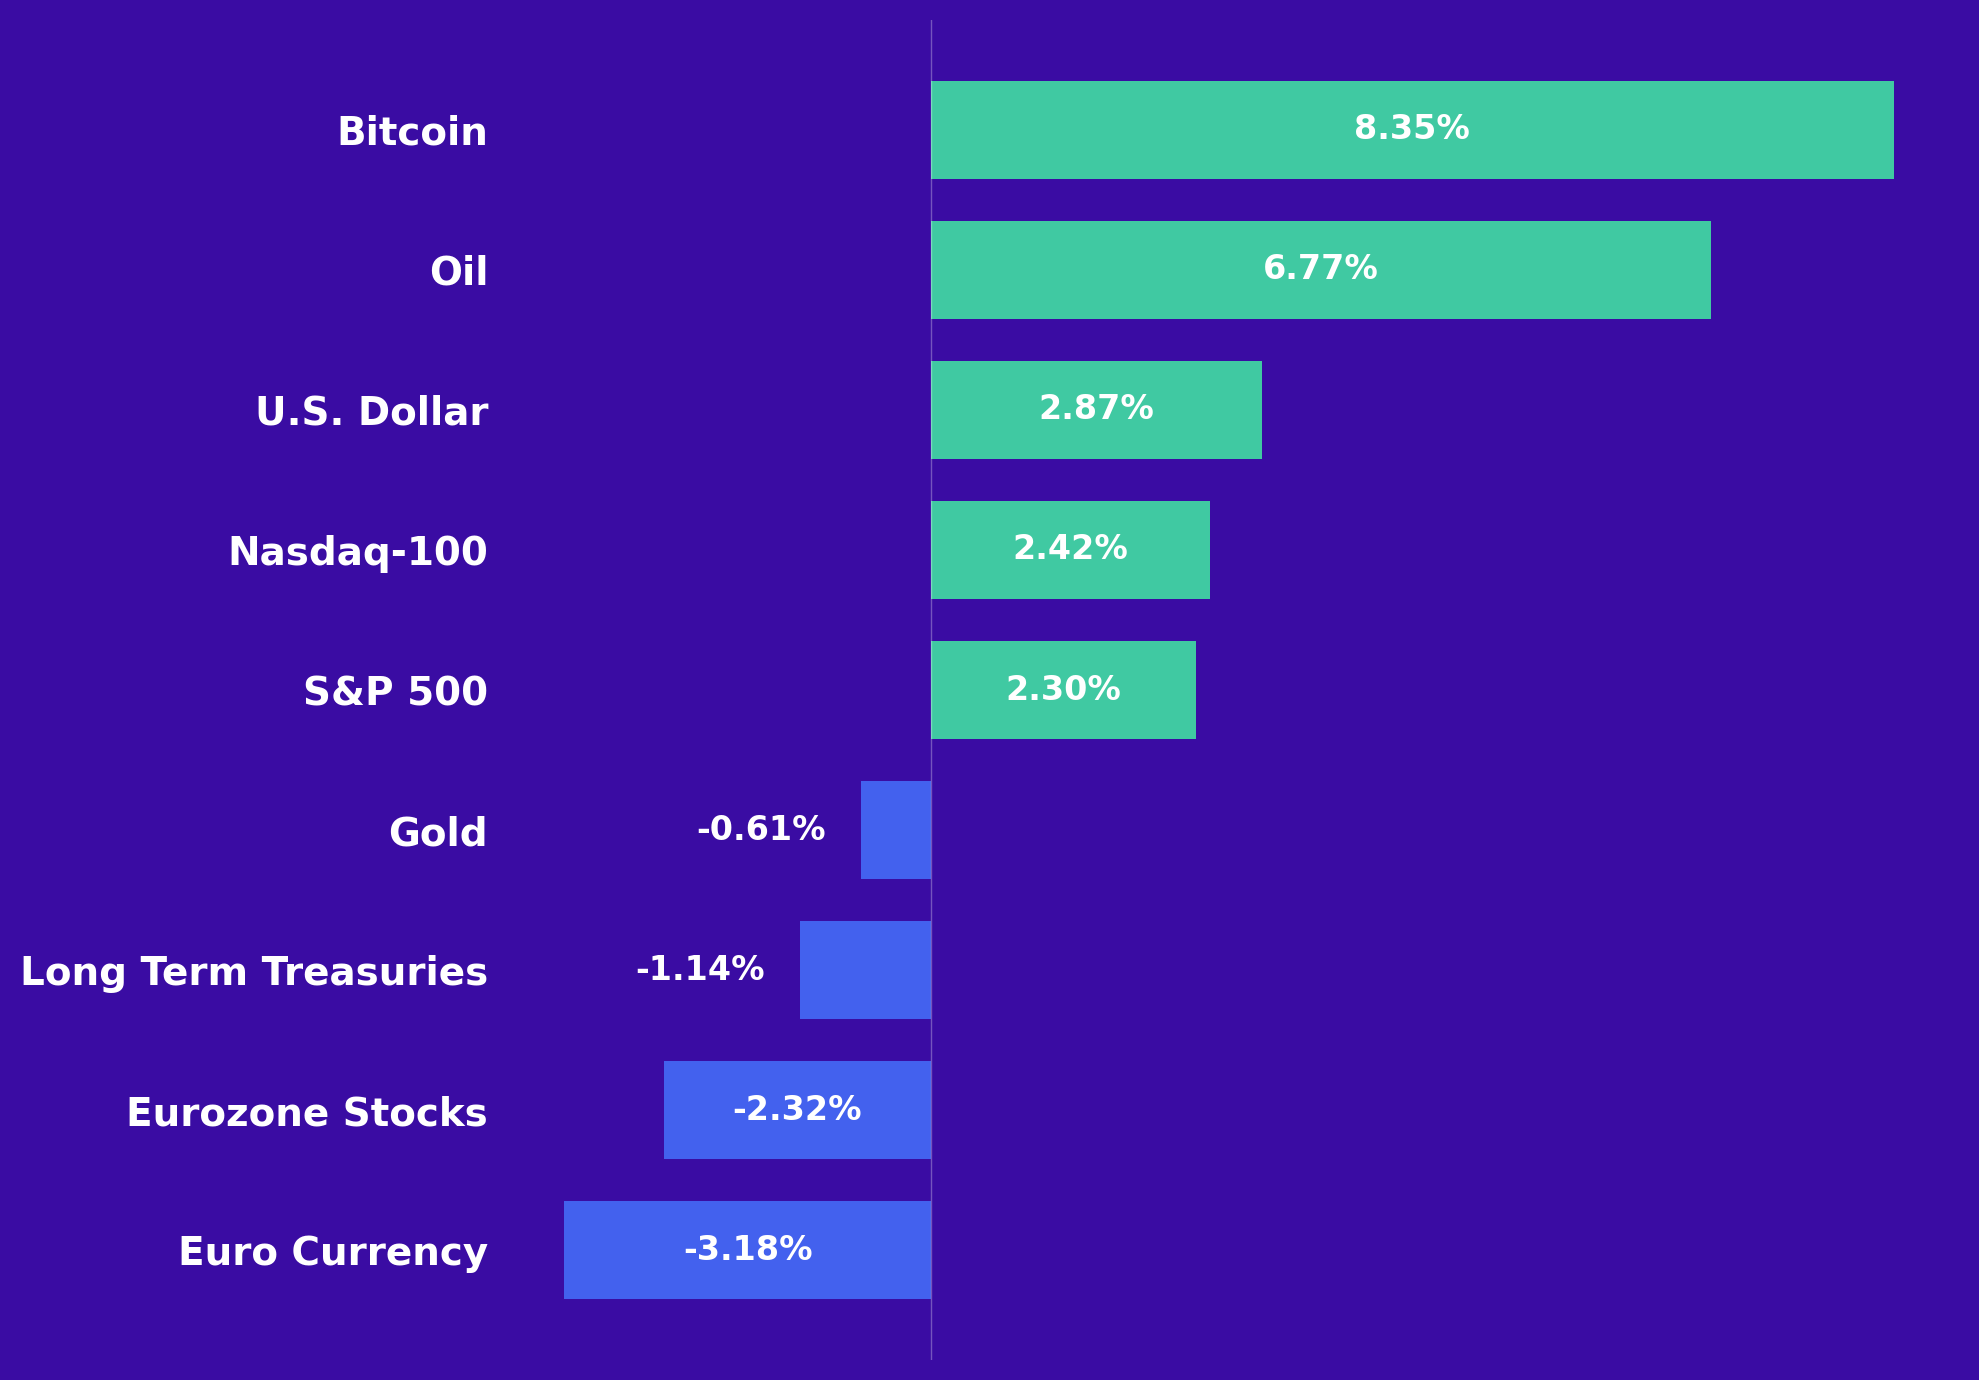
U.S. stock markets rose in July. Tech stocks led, and the Nasdaq-100 went up 2.42%. Large companies working with artificial intelligence, including Microsoft and Meta, reported strong results.
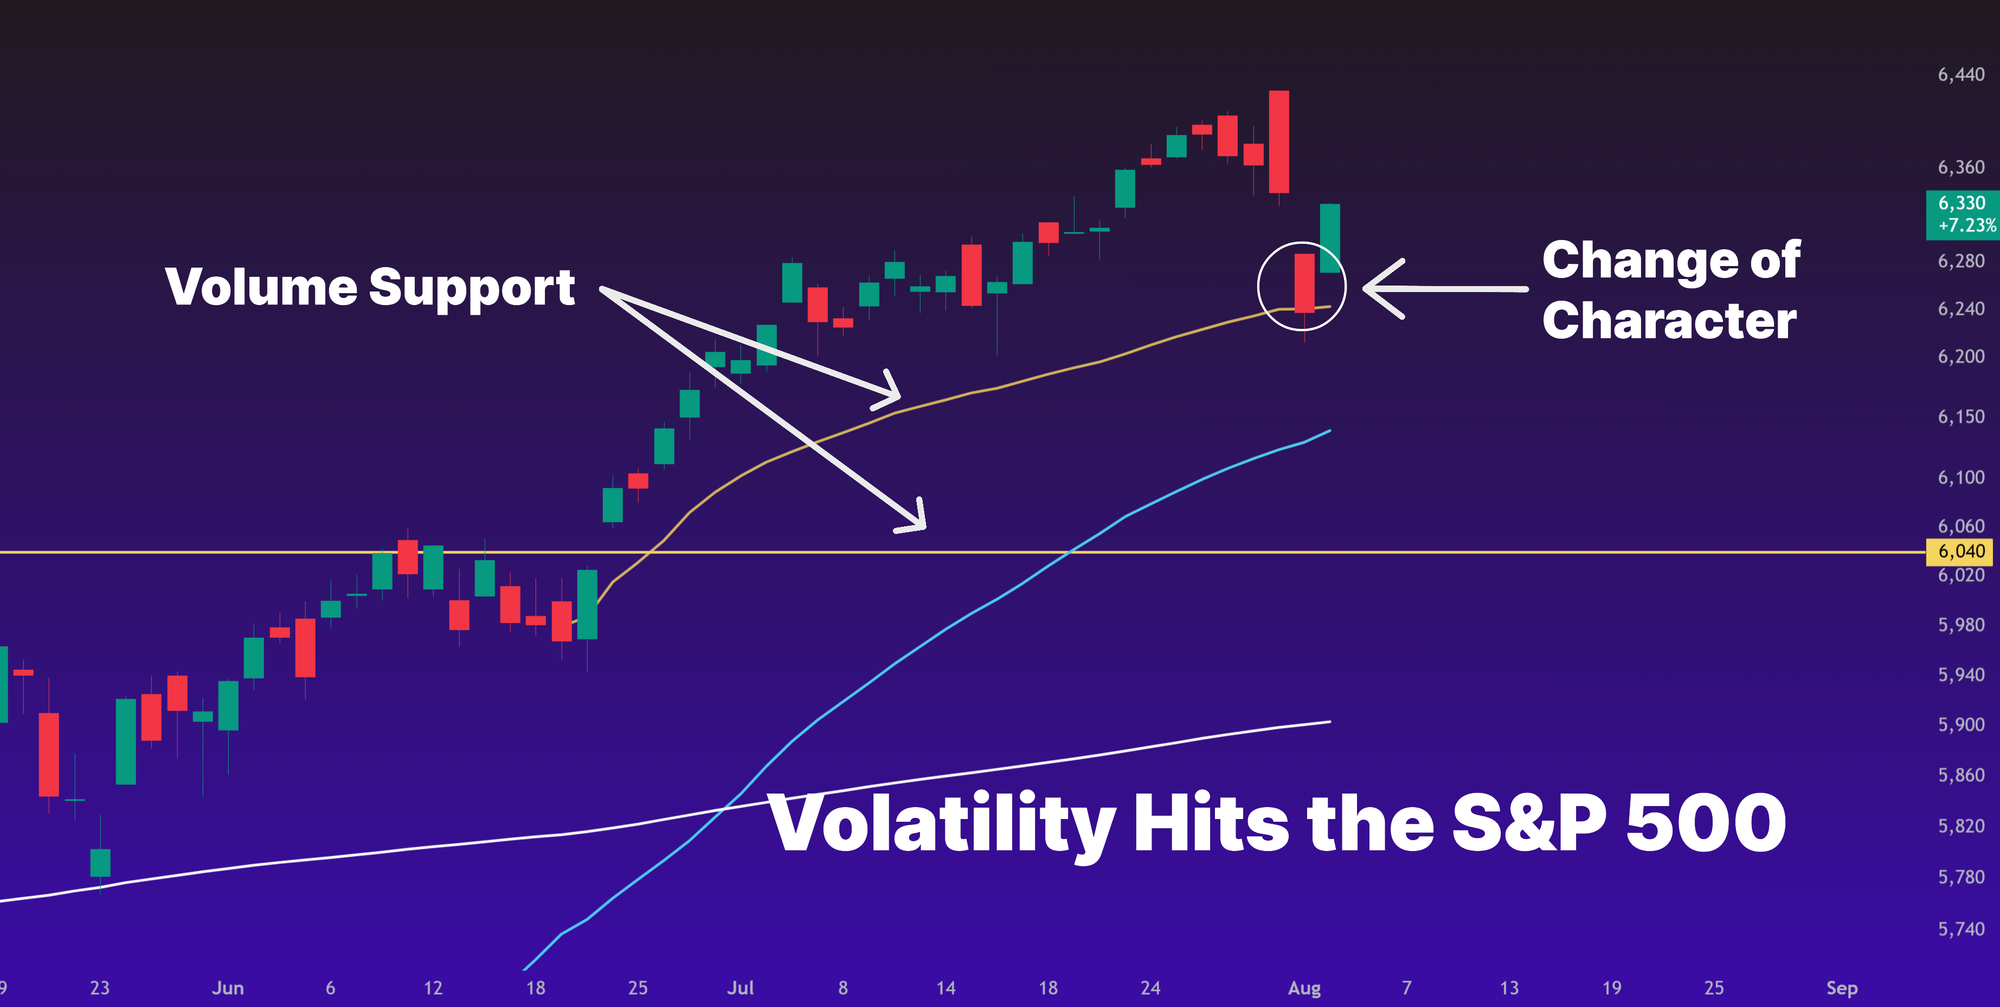
The S&P 500 increased by 2.3% and reached a new intraday record in the middle of the month. Headlines about tariffs and a negative jobs report on August 1st caused the S&P 500 to fall by 1.61%, the largest one-day decline since May. This drop marked a clear shift from the previously steady uptrend, but the index remains above key support levels, likely limiting near-term downside.
European equities were largely flat in local currency but dropped 2.32% in dollar terms as the euro fell 3.18%.
Long-term Treasury prices dropped by 1.14%, mainly due to high supply and persistent inflation. The Federal Reserve kept rates at 4.25% to 4.5% and indicated it would wait before making further changes.
The U.S. dollar gained 2.87% in July. Solid economic data, a stable Federal Reserve policy, and renewed tariff concerns supported the currency.
Gold fell by 0.61%. Higher real yields and a stronger dollar put pressure on gold prices.
Crude oil prices increased by 6.77%. OPEC Plus announced another production increase and geopolitical tensions continued.
Bitcoin rose by 8.35% to finish near $123,000. Inflows into spot exchange-traded funds and a favorable regulatory environment lifted sentiment.
Year-to-Date Returns
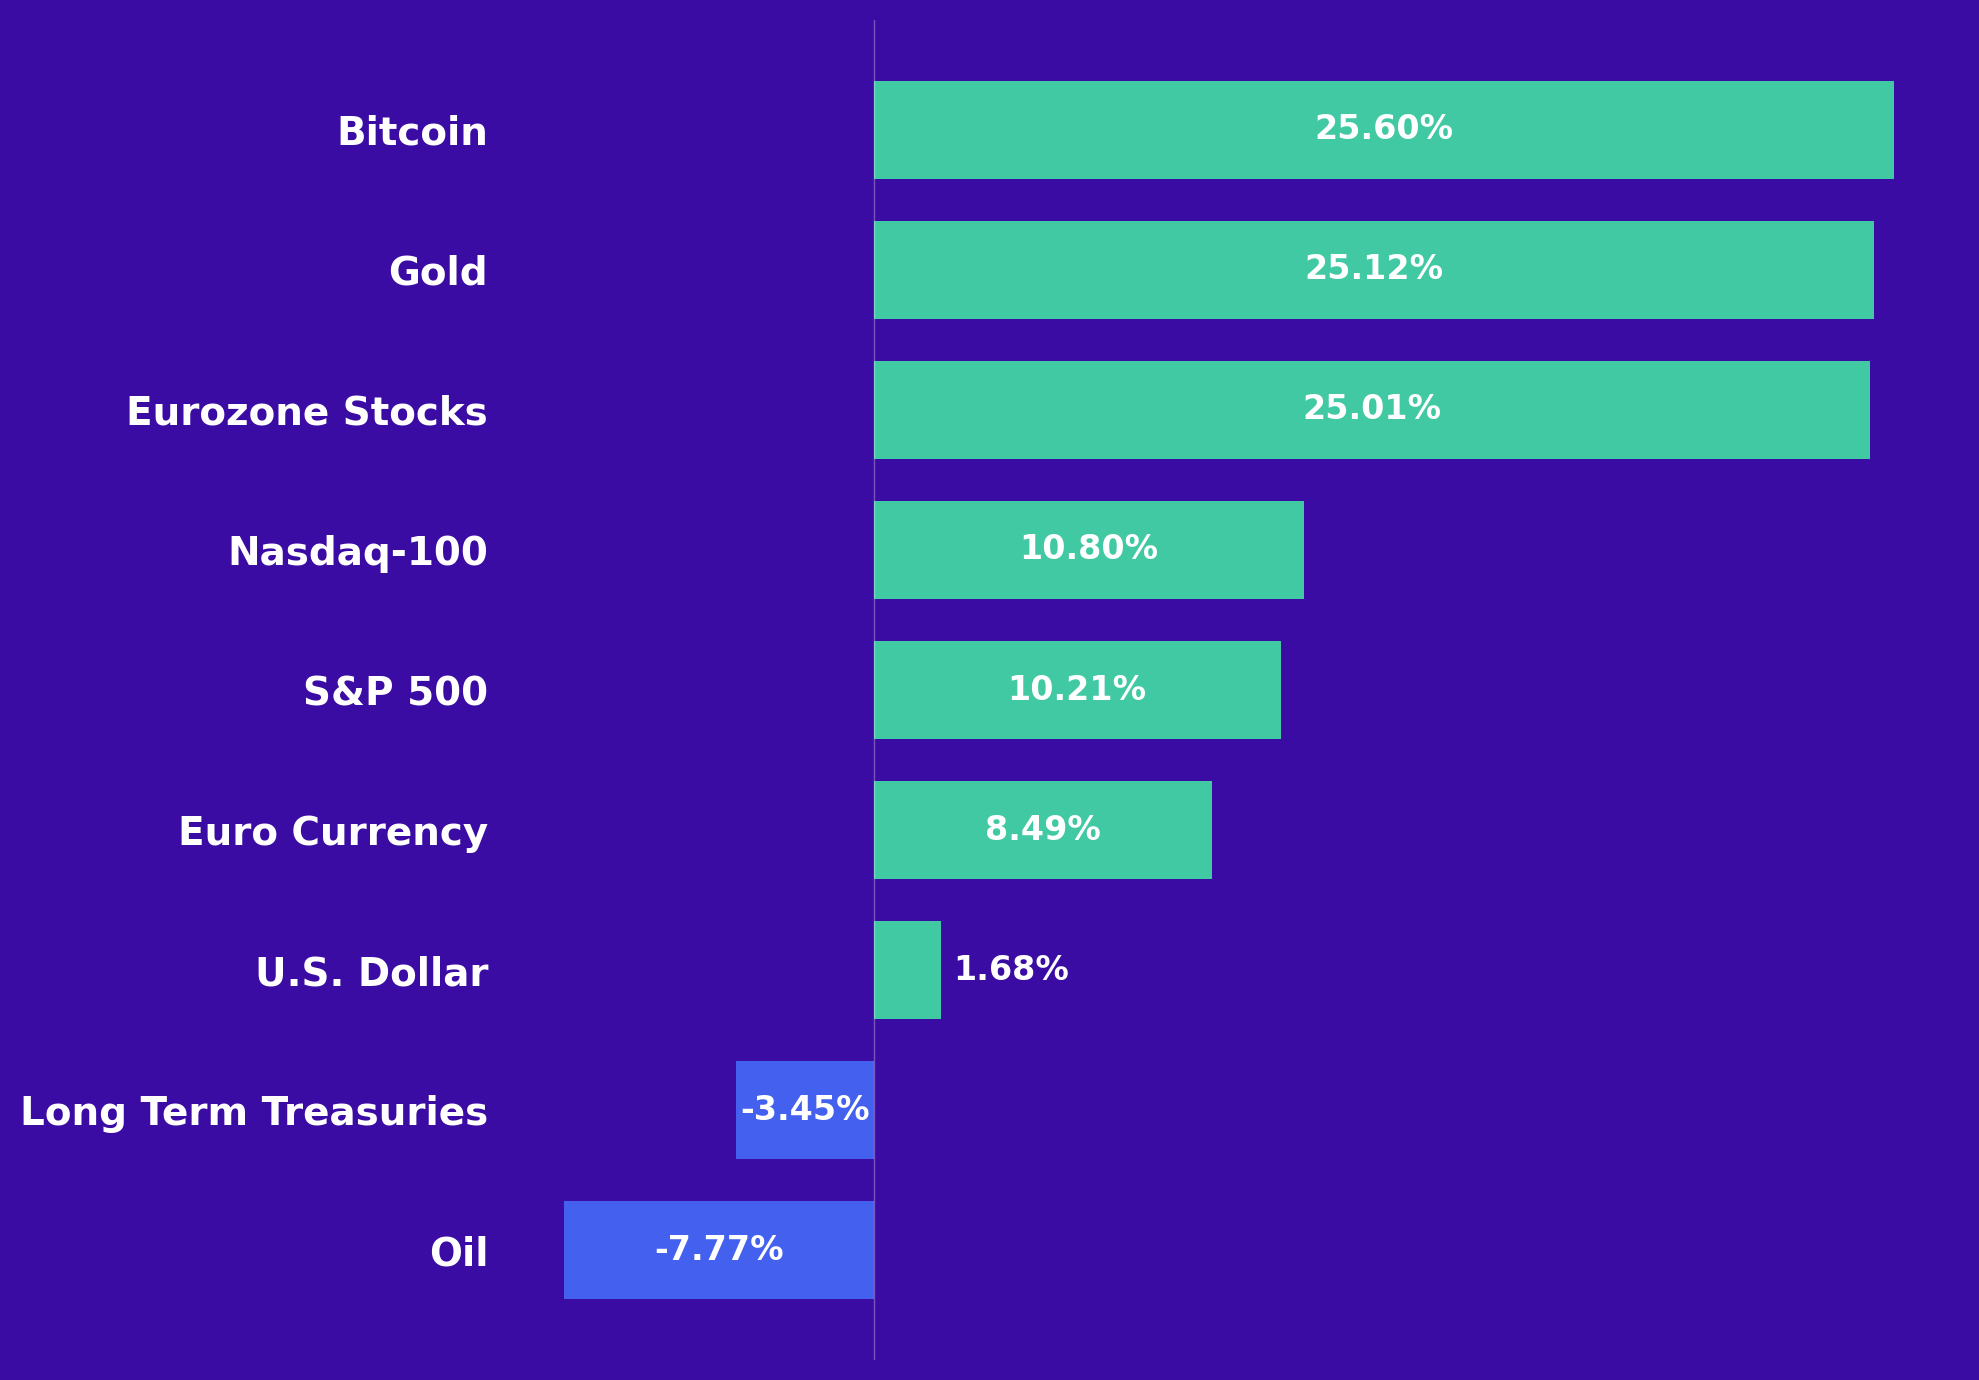
Bitcoin, gold, and Eurozone stocks have each gained about 25% year-to-date. U.S. large-cap technology is up nearly 11%, and the S&P 500 is up just over 10%. The euro has risen by 8.5% and the U.S. dollar is up 1.7%.
Long-term Treasuries are down more than 3%, and oil has dropped nearly 8%.
How to Measure Strategy Performance
To judge a strategy, many people look only at historical returns over 1, 3, and 5 years without considering the risk taken to get them. Did it require 50% drawdowns, or was it smoother? Compare it to other options. A 7% return may seem fine until you see that a simple 80/20 portfolio earned 10% with similar risk. Does the strategy fall sharply when stock markets fall, or does it move more independently? Taking a holistic view of a strategy before committing capital matters a lot.
Here is how the Asymmetric Edge strategy has performed based on these measures.
Trailing Returns
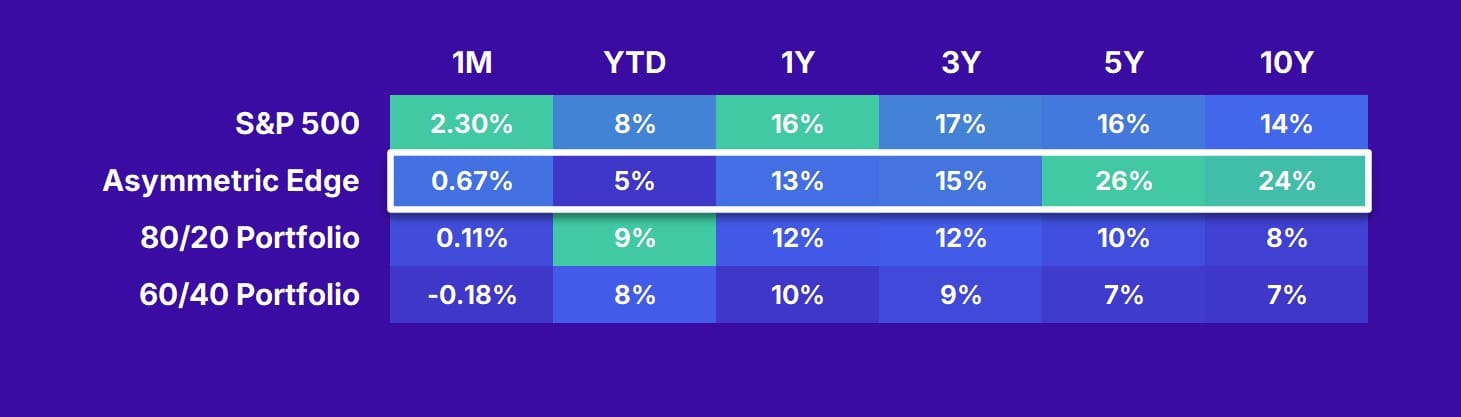
The table shows how Asymmetric Edge's performance compares to an aggressive portfolio, a traditional portfolio, and the S&P 500 across different periods. I use an aggressive mix of 80% stocks and 20% bonds to reflect a typical allocation for people in their 30s or 40s, and a traditional mix of 60% stocks and 40% bonds for those in their 50s or older.
In July, my portfolio returned 0.67%. This was higher than both the aggressive and traditional portfolios, but lower than the S&P 500. Year-to-date, Asymmetric Edge returned 4.95%.
Asymmetric Edge outperformed both comparison portfolios over 1, 3, 5, and 10-year periods. It also beat the S&P 500 over 5 and 10-year periods but trails the index over 1 and 3-year periods.
Sortino Ratios
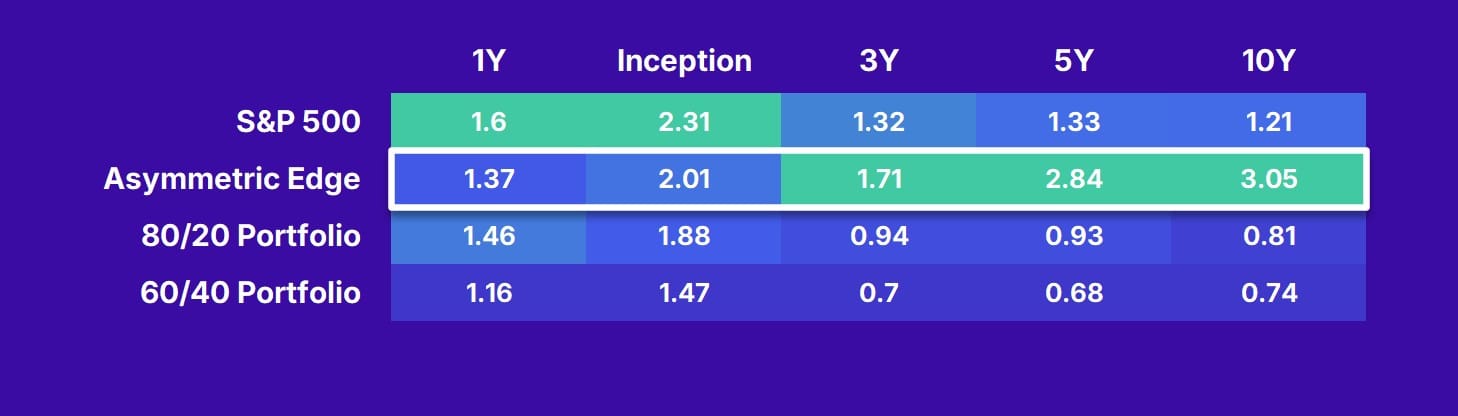
One of my preferred measures of performance is the Sortino ratio. This measure shows how much reward is earned for each unit of downside risk. A higher Sortino ratio means the portfolio is producing better risk-adjusted returns. If two investments have the same return, but one has smaller and/or fewer declines, that investment will have the higher Sortino ratio.
Since I started my strategy, it has produced more than twice the reward relative to downside risk. A typical 60/40 portfolio over the same period has a ratio of about 1.5. In backtests, Asymmetric Edge has outperformed all tracked strategies on this measure over the trailing 3, 5, and 10-year periods, as well as since its inception in January 2024. Over the past year, the portfolio’s Sortino ratio is 1.37, placing it second among the comparison portfolios, and only slightly behind an 80/20 allocation at 1.46.
Diversification
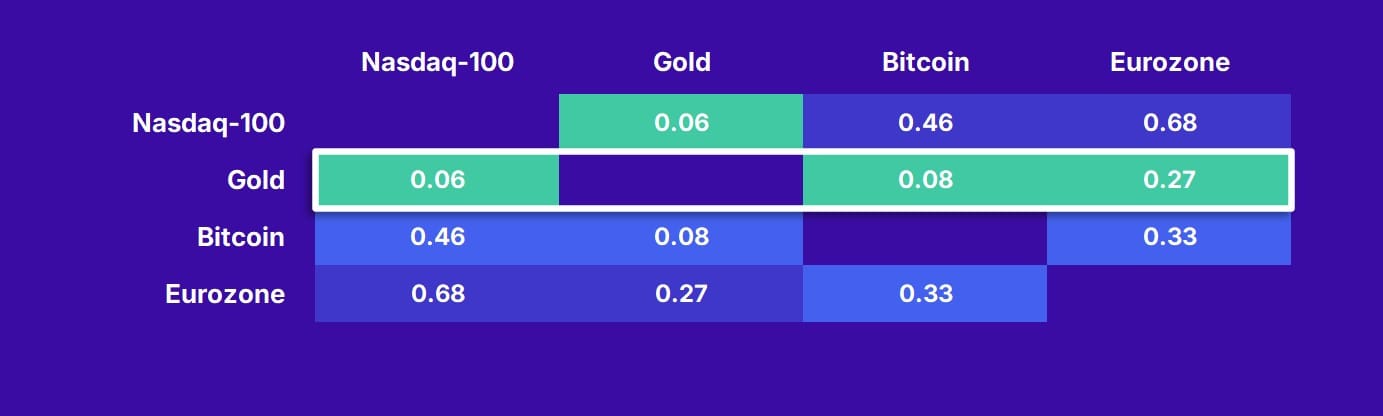
The table above highlights a key aspect of this strategy: minimizing correlation between portfolio assets can help reduce losses and create steadier returns. It shows the correlations between each asset I currently own in my portfolio. Lower values mean the assets are less likely to move together. For example, gold and the Nasdaq-100 have a correlation of 0.06, meaning their price changes are almost entirely independent. By including assets like gold and Bitcoin, which often move differently from stocks, they can help limit losses during stock market downturns and even lead to overall portfolio gains.
August Outlook & Portfolio Allocations
August has often been a weaker month for stocks. Since 1990, the S&P 500 has averaged a return of -0.6% in August, and the Nasdaq-100 has gained 0.3% on average. The Volatility Index (VIX) also tends to rise, showing higher market uncertainty.
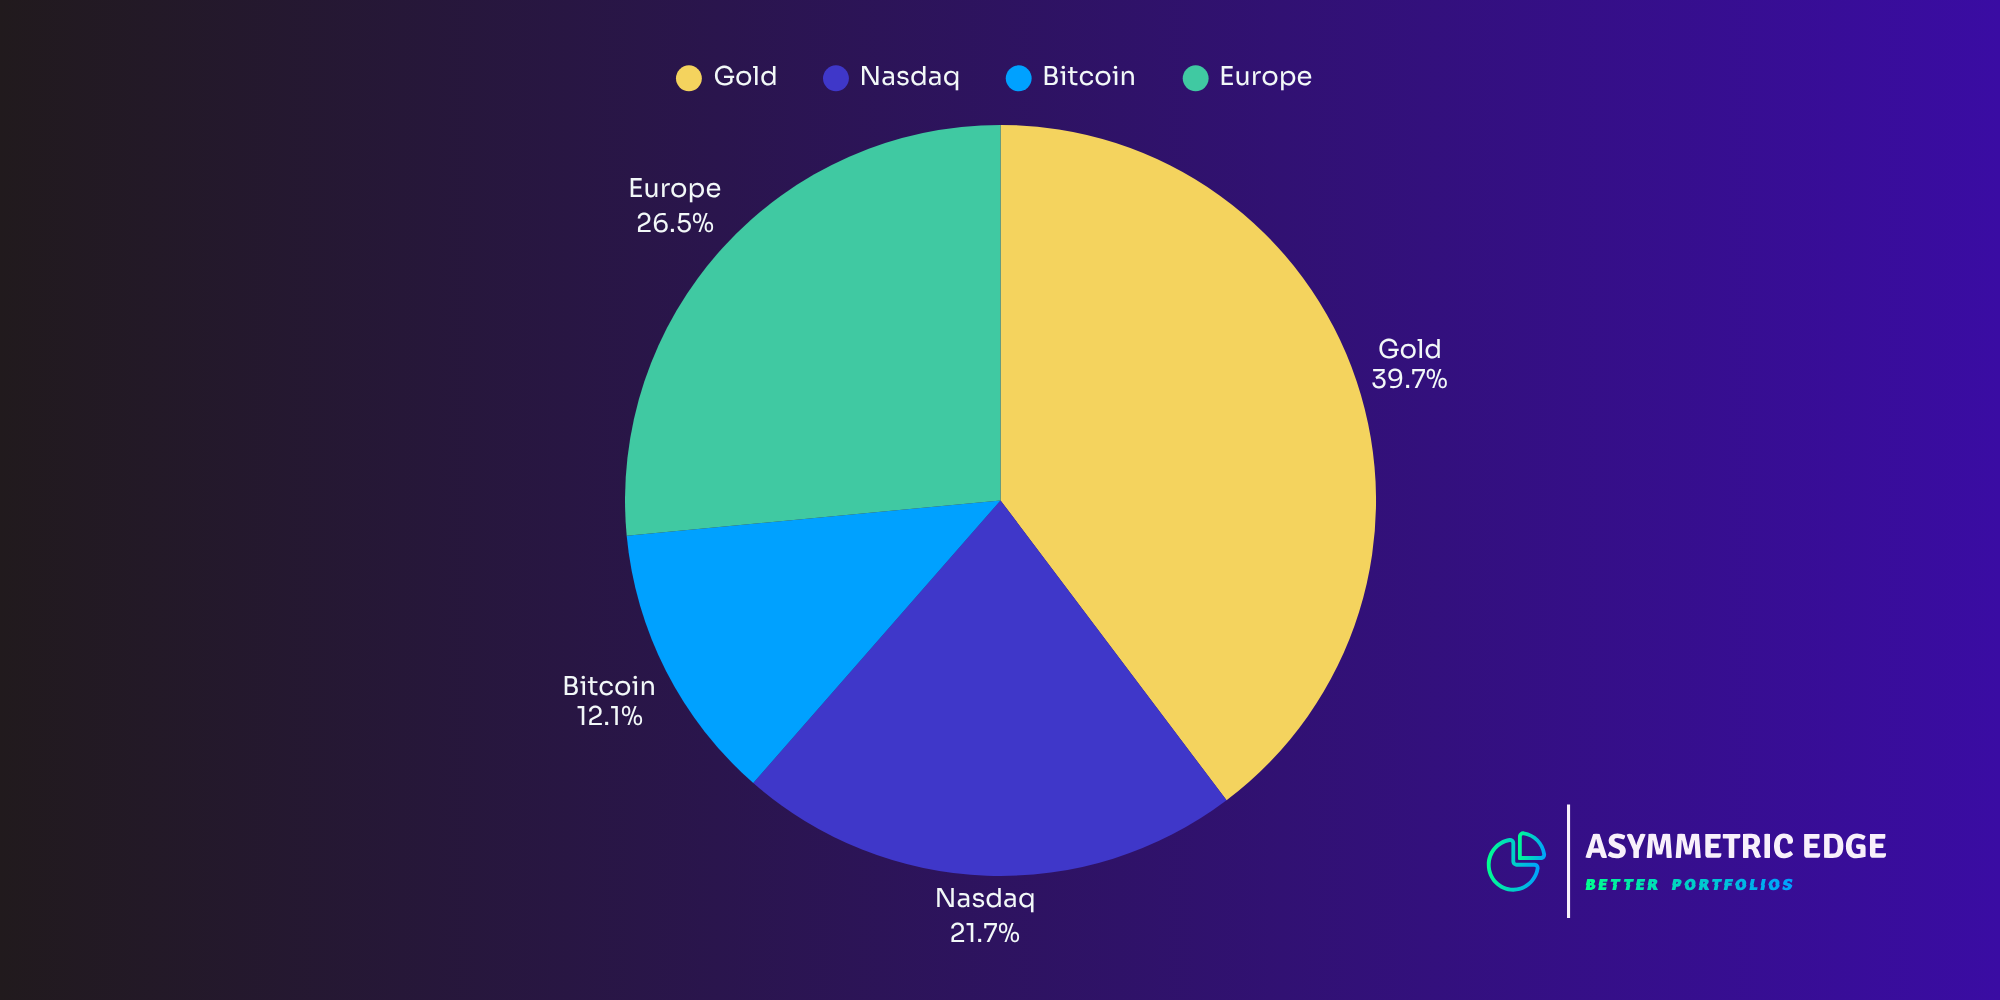
I made small adjustments to the August allocation percentages. Gold, Bitcoin, Eurozone stocks, and the Nasdaq remain in the portfolio. These monthly rebalances, even when allocation percentages change little, are important. They involve trimming positions that gained in the previous month and moving those profits into other assets to bring them back to their target allocation.
Here are the ETFs I use and the percentage allocated to each. I currently hold positions in all of them as part of my own portfolio.
- GLD (Gold): 39.72%
- EZU (Eurozone): 26.50%
- QQQ (Nasdaq-100): 21.72%
- IBIT (Bitcoin): 12.06%
Purchasing Shares
Here's a link to the Google Sheet I use to rebalance my portfolio. The spreadsheet pulls live ETF prices and helps me calculate how many shares to buy or sell based on the data provided.
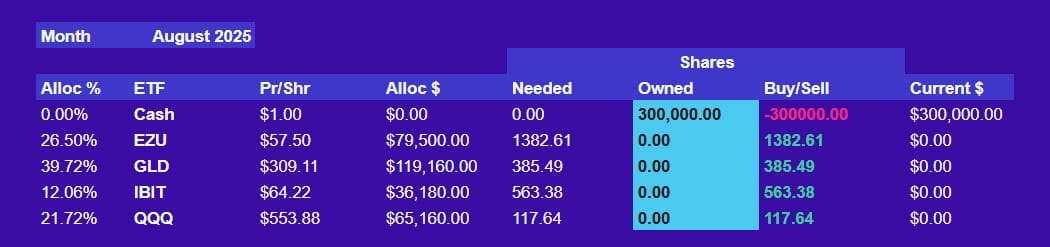
Calculator Terms of Use
This tool is for my personal use and shared for informational purposes only. While I strive to ensure accuracy, I make no representation or warranty as to its accuracy or completeness. Users should verify all calculations independently. Please consult your own advisor before using similar tools.
Asset Deep-Dive: Bitcoin
Bitcoin’s price continues to break records, leading many investors to wonder how high it could climb in the current cycle. This overview breaks down the price zones, key drivers, and timing factors that may shape Bitcoin’s next move.
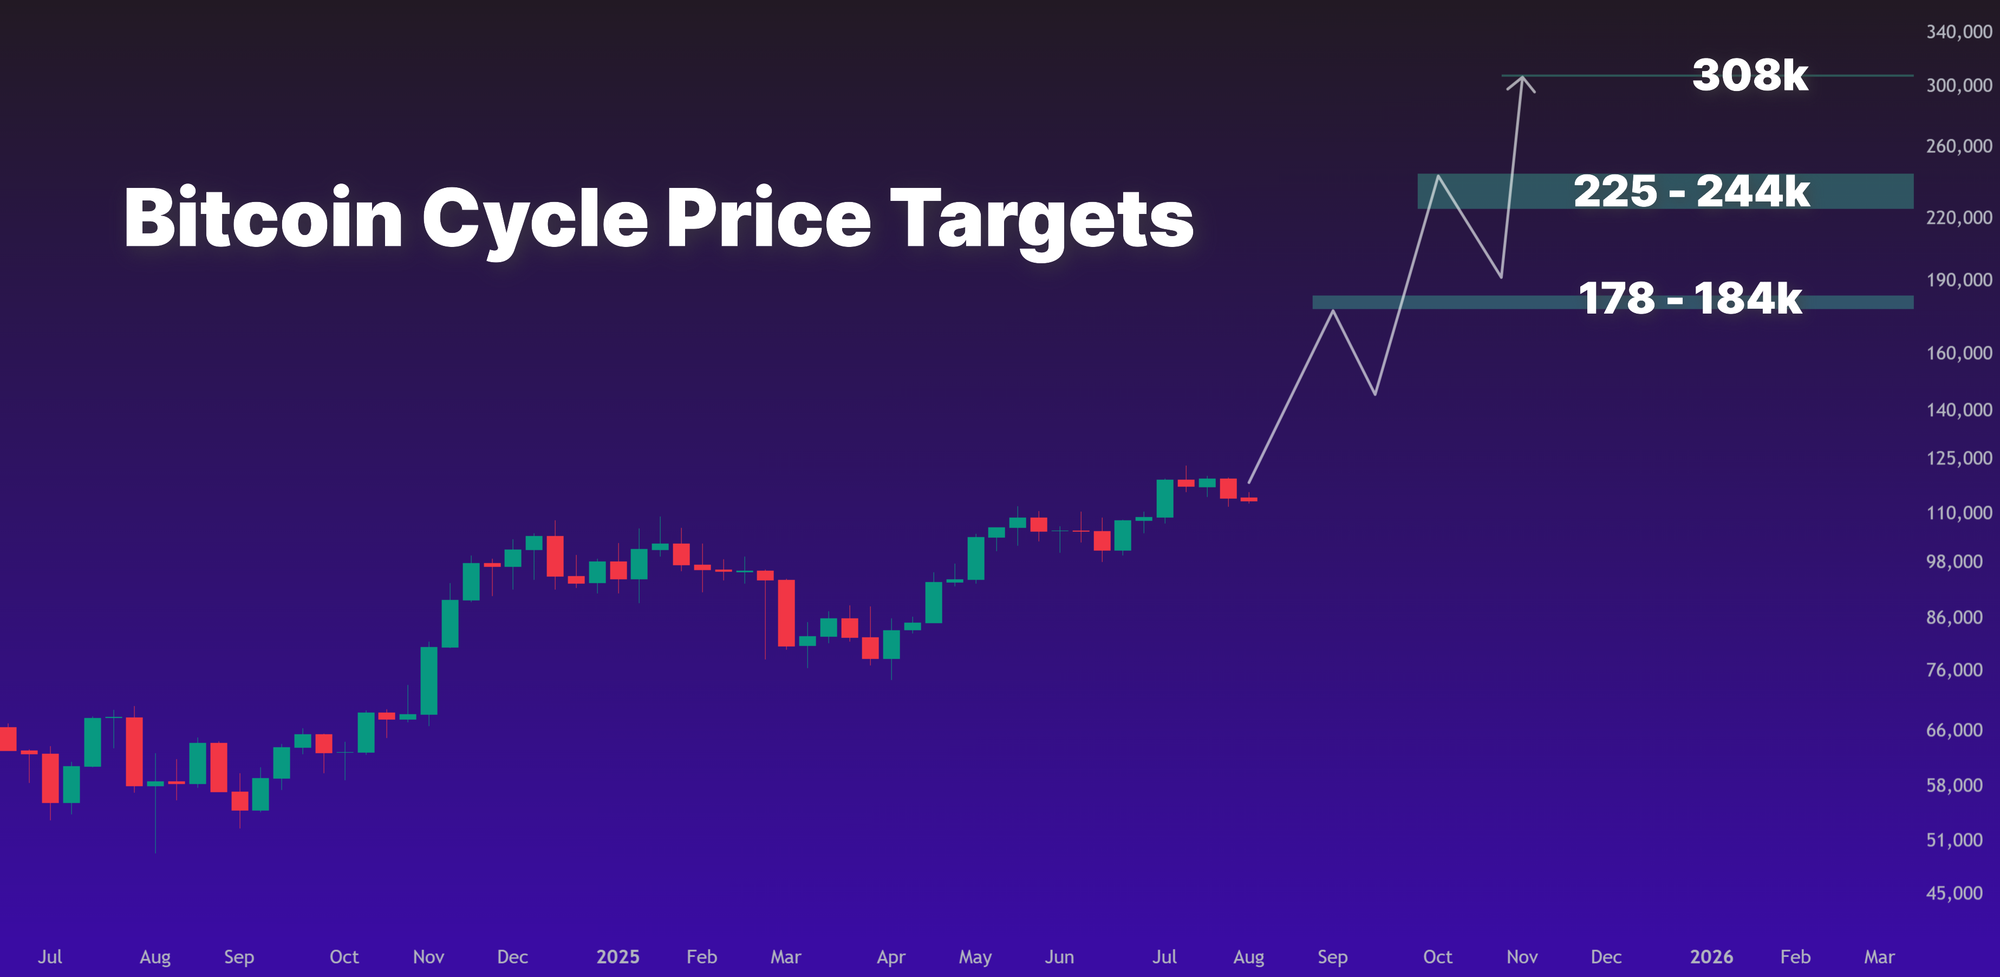
Overview of Price Targets
I no longer trade Bitcoin or other crypto assets on their own, but I find it useful to map out price zones because many readers hold significant amounts and ask how high it might go. Based on several technical and historical methods, I see possible Bitcoin price zones of:
- First range: $178,000 to $184,000
- Next range: $225,000 to $244,000
- Upper scenario: $308,000
These are personal opinions, not predictions or guarantees, and actual prices could be far lower or higher.
These ranges may seem high relative to Bitcoin’s current level around $115,000, but past market cycles have produced similar gains. I see room for potential upside, yet I also recognize that market conditions can change quickly.
If you are interested in how I determined my price targets, the analysis follows. Otherwise, feel free to skip this final section.
Bitcoin Halving Cycle
To understand why Bitcoin’s price tends to move in four-year cycles, it helps to understand what a halving cycle is. About every four years, the Bitcoin protocol cuts miner rewards in half in an event called a halving. In 2009, miners received 50 BTC per block. That dropped to 25 in 2012, to 12.5 in 2016, to 6.25 in 2020, and to 3.125 on April 20, 2024. Each halving reduces new supply. If demand stays steady or increases, basic supply and demand theory suggests the price is likely to rise.
Historical Cycle Peaks
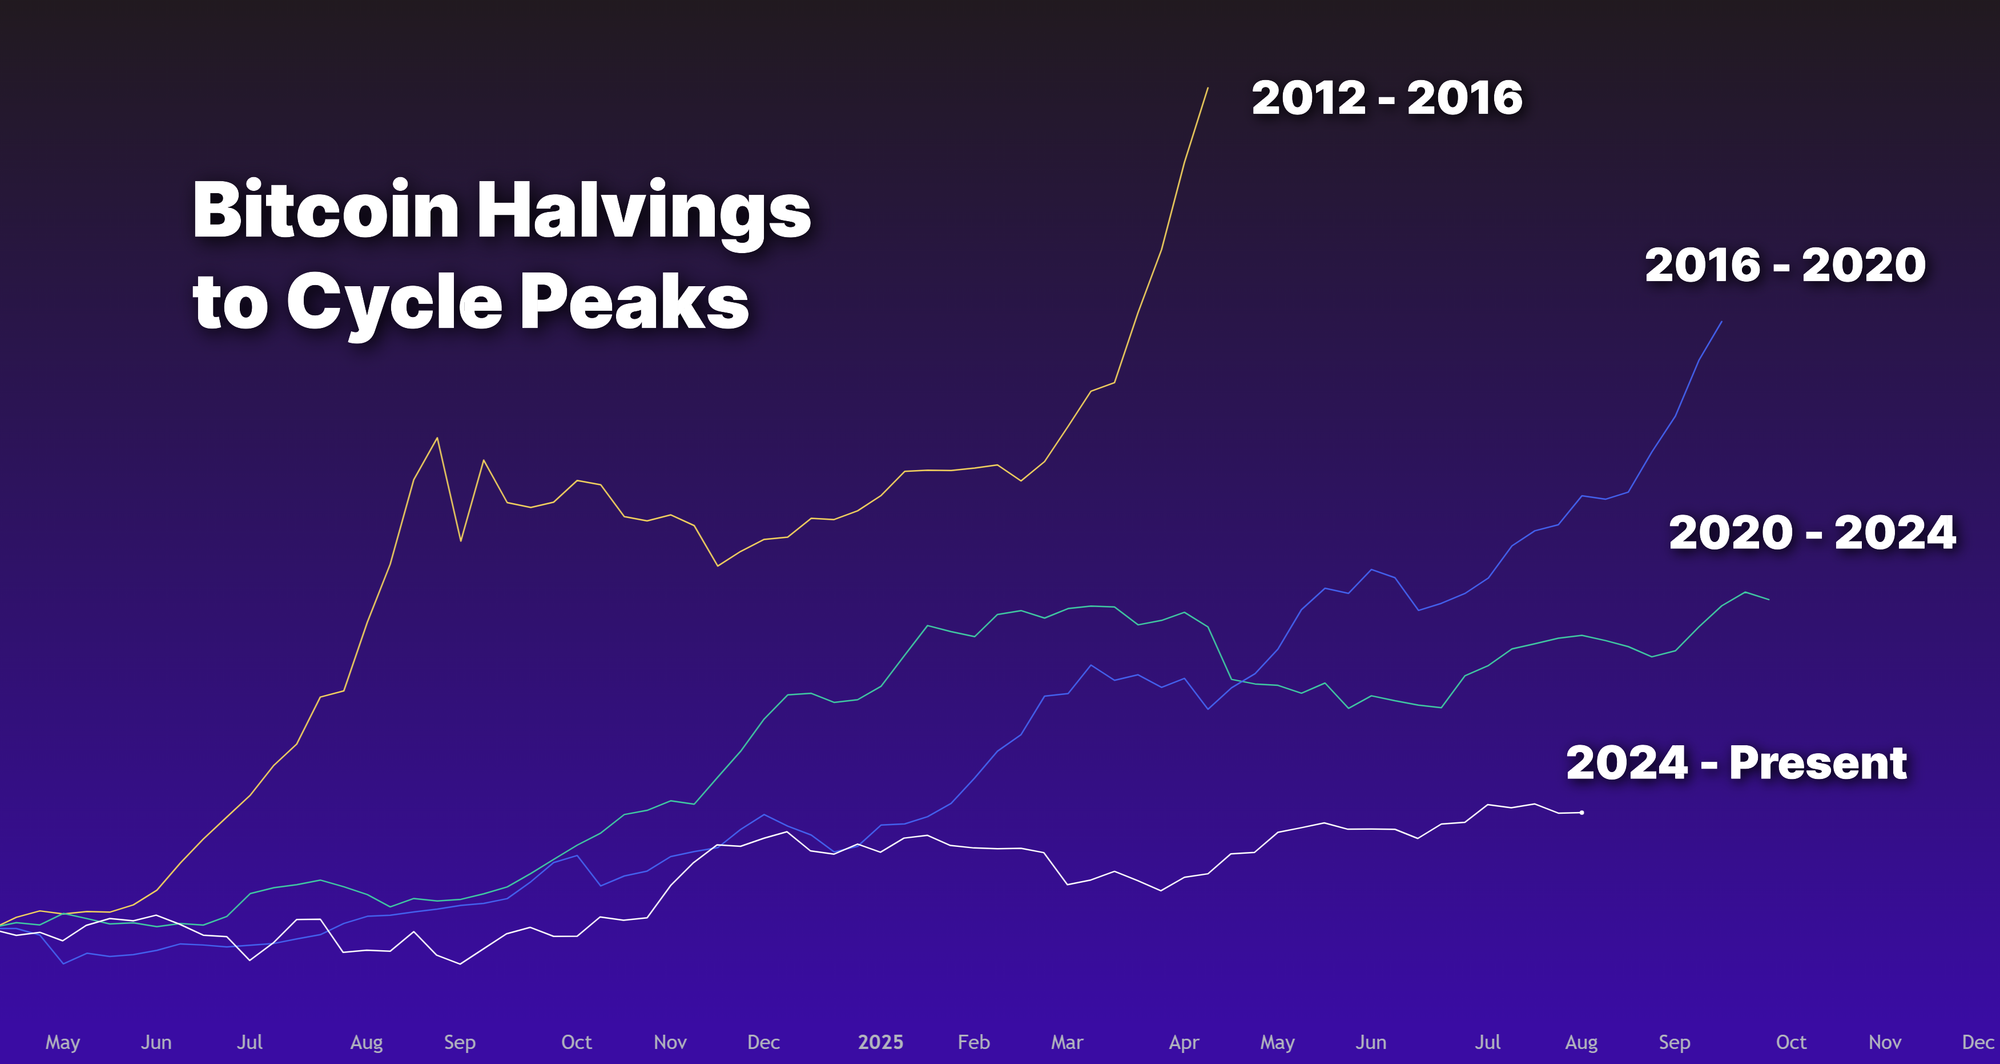
Bitcoin tends to peak roughly 560 days after each halving, putting the next cycle high in late October or early November 2025.
We can look at historical percentage gains from each previous bull run as a guide to possible outcomes this cycle:
- After the November 28, 2012 halving, the price rose 10,250%.
- Following the July 9, 2016 halving, the price rose nearly 3,000%.
- After the May 11, 2020 halving, the price rallied 705%.
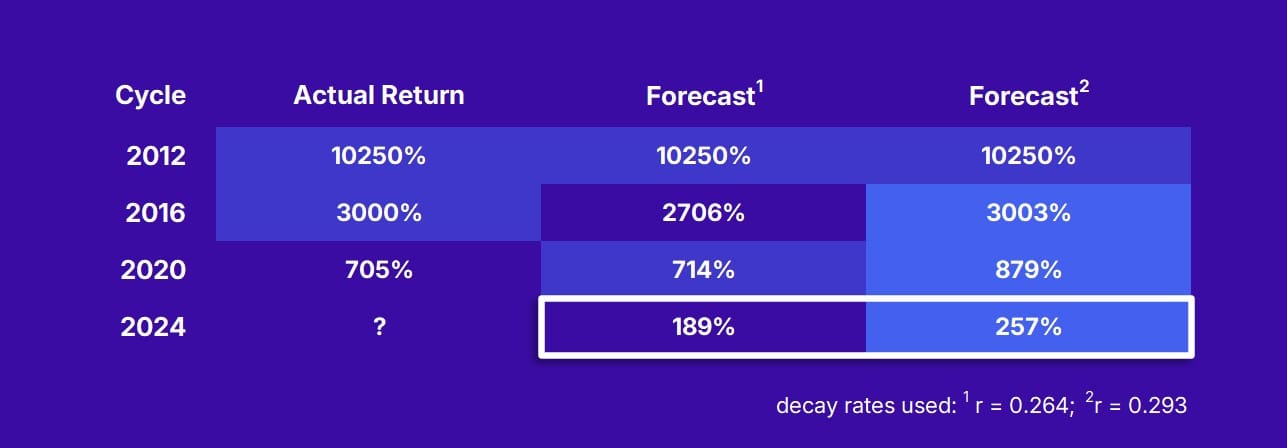
These figures, along with my forecast for the current cycle, are shown in the chart above.
Each cycle’s returns have declined in a steady pattern. To estimate this cycle’s potential gain, an exponential decay model fits the historical data well. In this pattern, each cycle’s gain is a consistent fraction of the one before it. Multiplying the prior cycle’s return by 0.264 or 0.294 closely matches past results. For this cycle, those models suggest gains of 189% and 257%, implying possible prices of about $184,000 and $225,000.
Technical Analysis
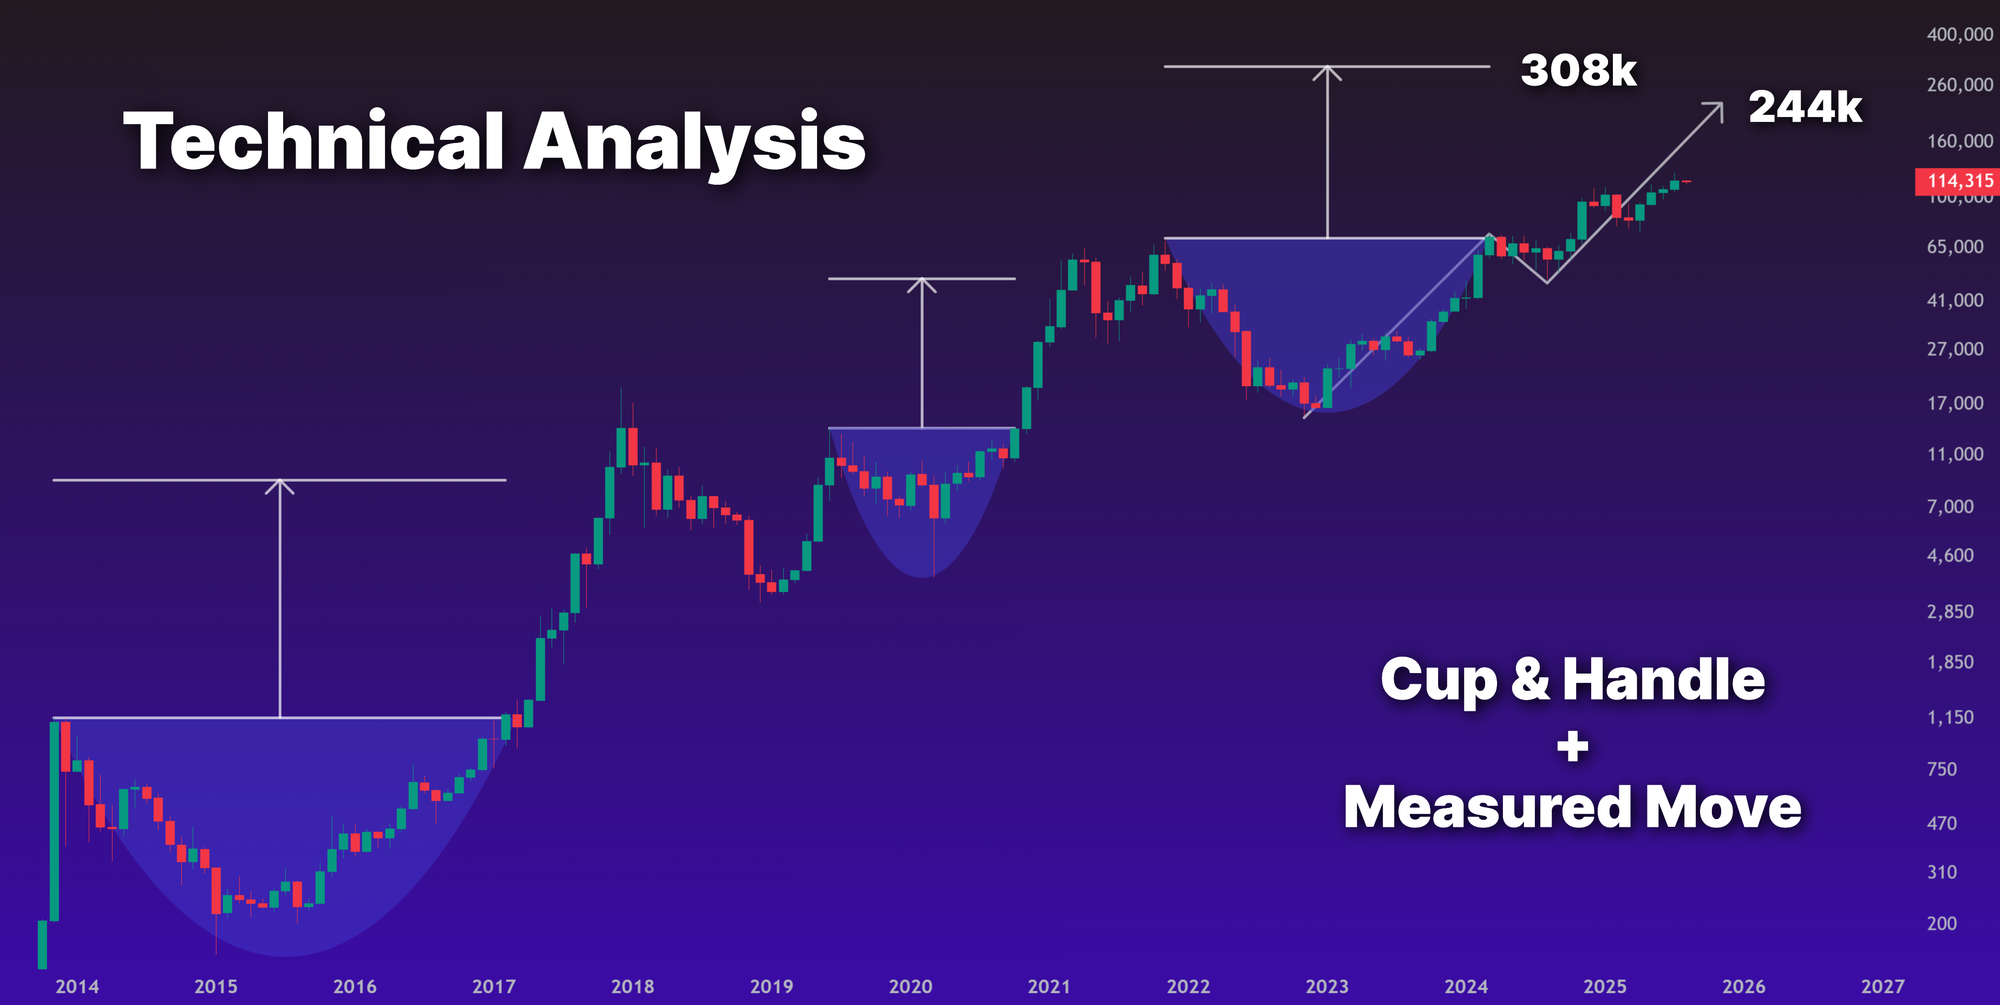
Technical analysis often works well in crypto because it trades 24 hours a day and is the closest thing to a truly free market, so price reflects real-time sentiment. Two simple chart patterns I use are:
- Cup formation plus measured-move extension – Take the percentage rise from the cup bottom to its rim and project that percentage from the rim upward. Past cycles came very close to those targets, pointing to roughly $308,000 today.
- Measured moves off pullbacks – Measure the percentage gain of an initial leg, then project that same percentage from the trough of the following pullback. From the 2022 low to the March 2024 peak and back to the April 2024 pullback trough, this method targets about $244,000.
On-Chain Indicators
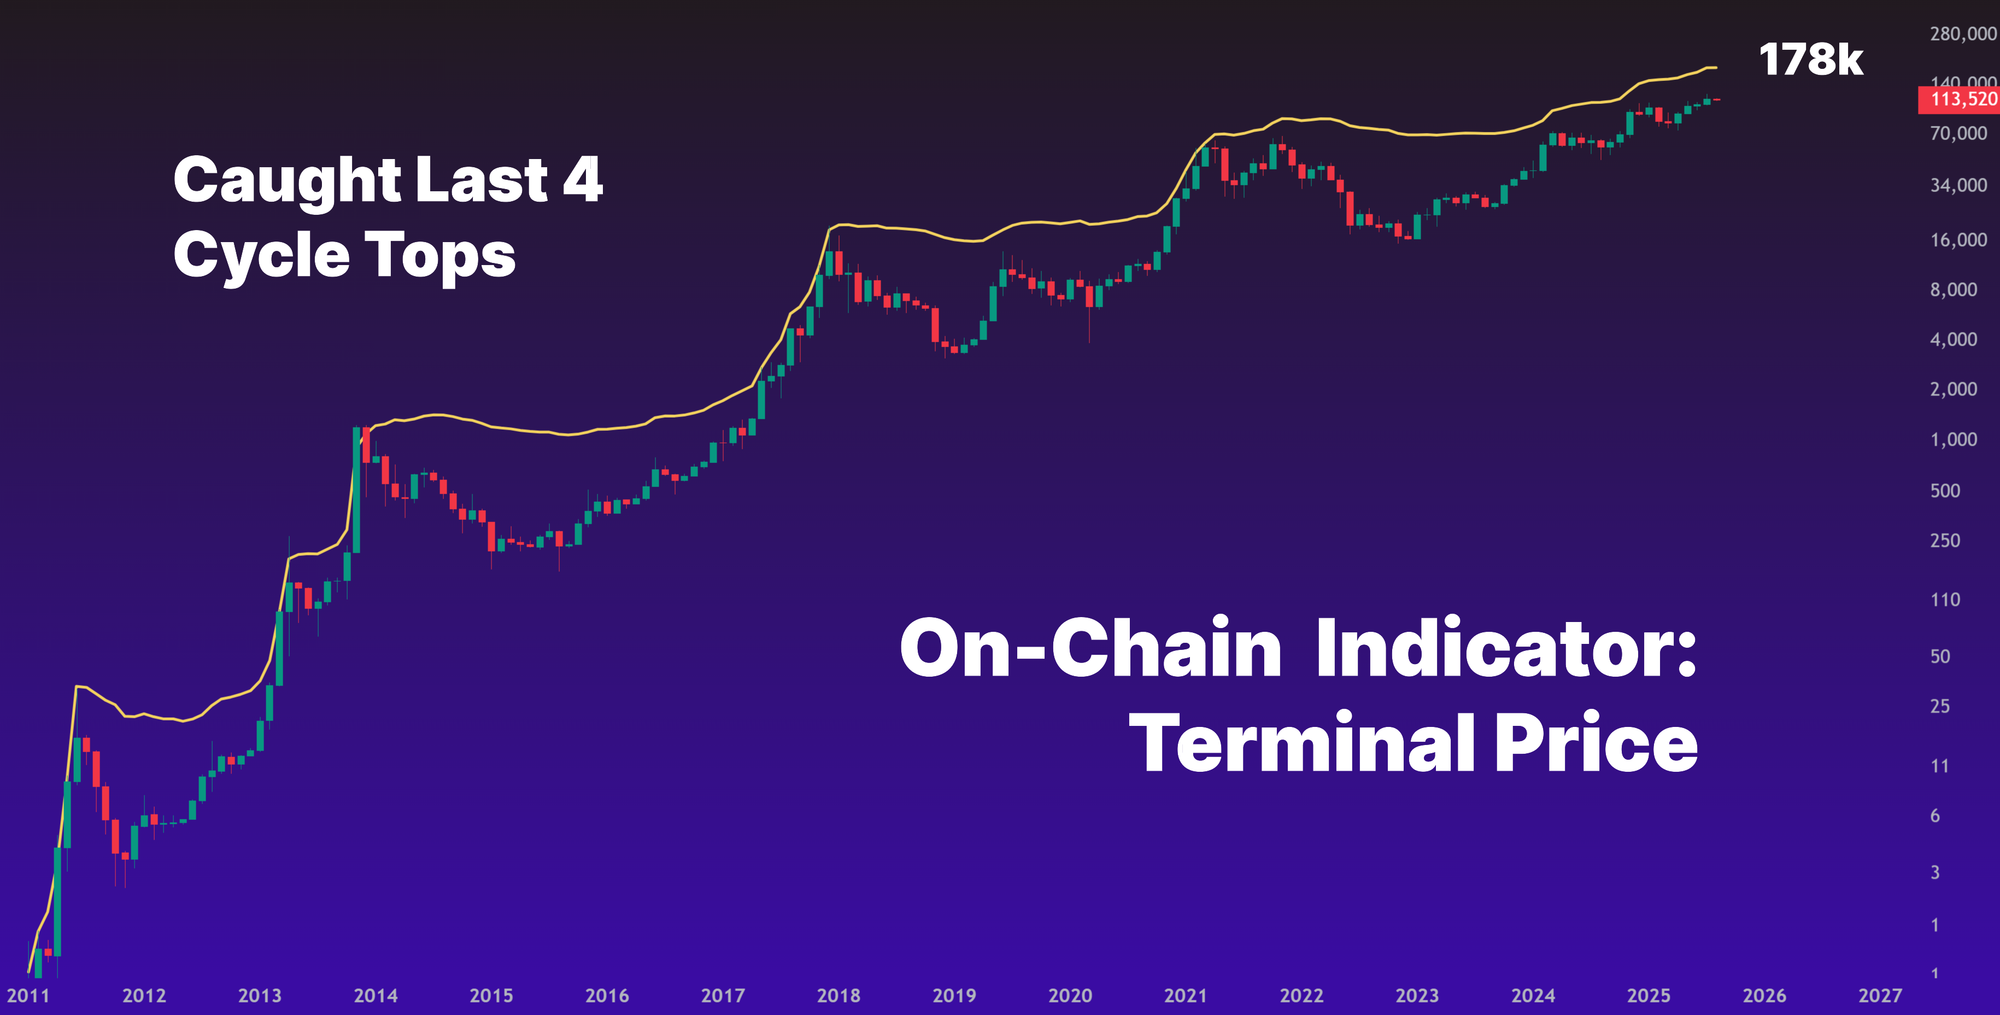
Bitcoin's blockchain is very transparent, with transactions and addresses available for anyone to view. This transparency enables creating indicators like Terminal Price, which uses cumulative transferred value, coin age, supply, and network age, then scales by maximum supply to estimate cycle highs. You can see this indicator in the table above. In past cycles Terminal Price lined up closely with peaks in 2013, 2017, and 2021. Today it points to a potential cycle top around $178,000.
Market Drivers in 2025
Reaching these high price targets will depend on strong catalysts and solid fundamentals. Some of the key factors driving Bitcoin’s gains this year include:
- Institutional demand – U.S. spot Bitcoin ETFs are absorbing new supply faster than miners can produce it. Over 130 public companies now hold Bitcoin on their balance sheets and Wall Street brokers offer it to clients.
- Holder behavior – On-chain data shows most long-term holders are not selling large paper gains, signaling confidence in even higher prices.
- Macro tailwinds – Lower interest rates and increased U.S. regulatory clarity add to bullish sentiment.
This newsletter is for informational purposes only and should not be considered as investment advice or a recommendation of any particular security, strategy, or investment product. The information contained herein has been obtained from sources believed to be reliable, but its accuracy and completeness are not guaranteed. Opinions expressed are subject to change without notice. This material is not an offer to sell or a solicitation of an offer to buy any security.
The author may hold positions in securities mentioned in this newsletter. All expressions of opinion are subject to change without notice in reaction to shifting market conditions. Data contained herein from third-party providers is obtained from what are considered reliable sources. However, its accuracy, completeness, or reliability cannot be guaranteed.
Investment involves risk, including possible loss of principal. No investment strategy or risk management technique can guarantee returns or eliminate risk in any market environment.