June Recap & July Outlook
June marked a shift back to risk-on investing, with U.S. equities posting strong results. In this issue, I break down what drove performance, how I’m allocating for July, and why understanding your risk tolerance matters more than ever.


Welcome back! June was the first month my investment model shifted back to a risk-on approach after 3 months of cautious allocations.
Reducing heavy exposure to U.S. dollars (T-bills) and increasing positions in equities, gold, and bitcoin proved to be a smart decision, as June was a strong month for just about every asset except the U.S. dollar.
Want Allocations Sooner?
Free members get my portfolio allocations too—but paid members receive them as soon as they’re released on the last trading day of each month. Upgrade if you want to stay a step ahead.
In this update, I’ll recap recent asset performance and key market news, share my S&P 500 outlook, and discuss the psychology of loss aversion. I’ll share how I developed a resilient, adaptable strategy that matches my risk tolerance and is built for the long term. I’ll also review July portfolio allocations and highlight notable charts, including one on uranium's stealth bull market.

This newsletter shares my personal investing approach and is for informational purposes only. I am not a financial advisor. Please do your own research or consult with a professional before making any investment decisions.
June Snapshot: Performance & News
A quick overview of asset and portfolio performance in June and so far in 2025, paired with the key news driving market movements.
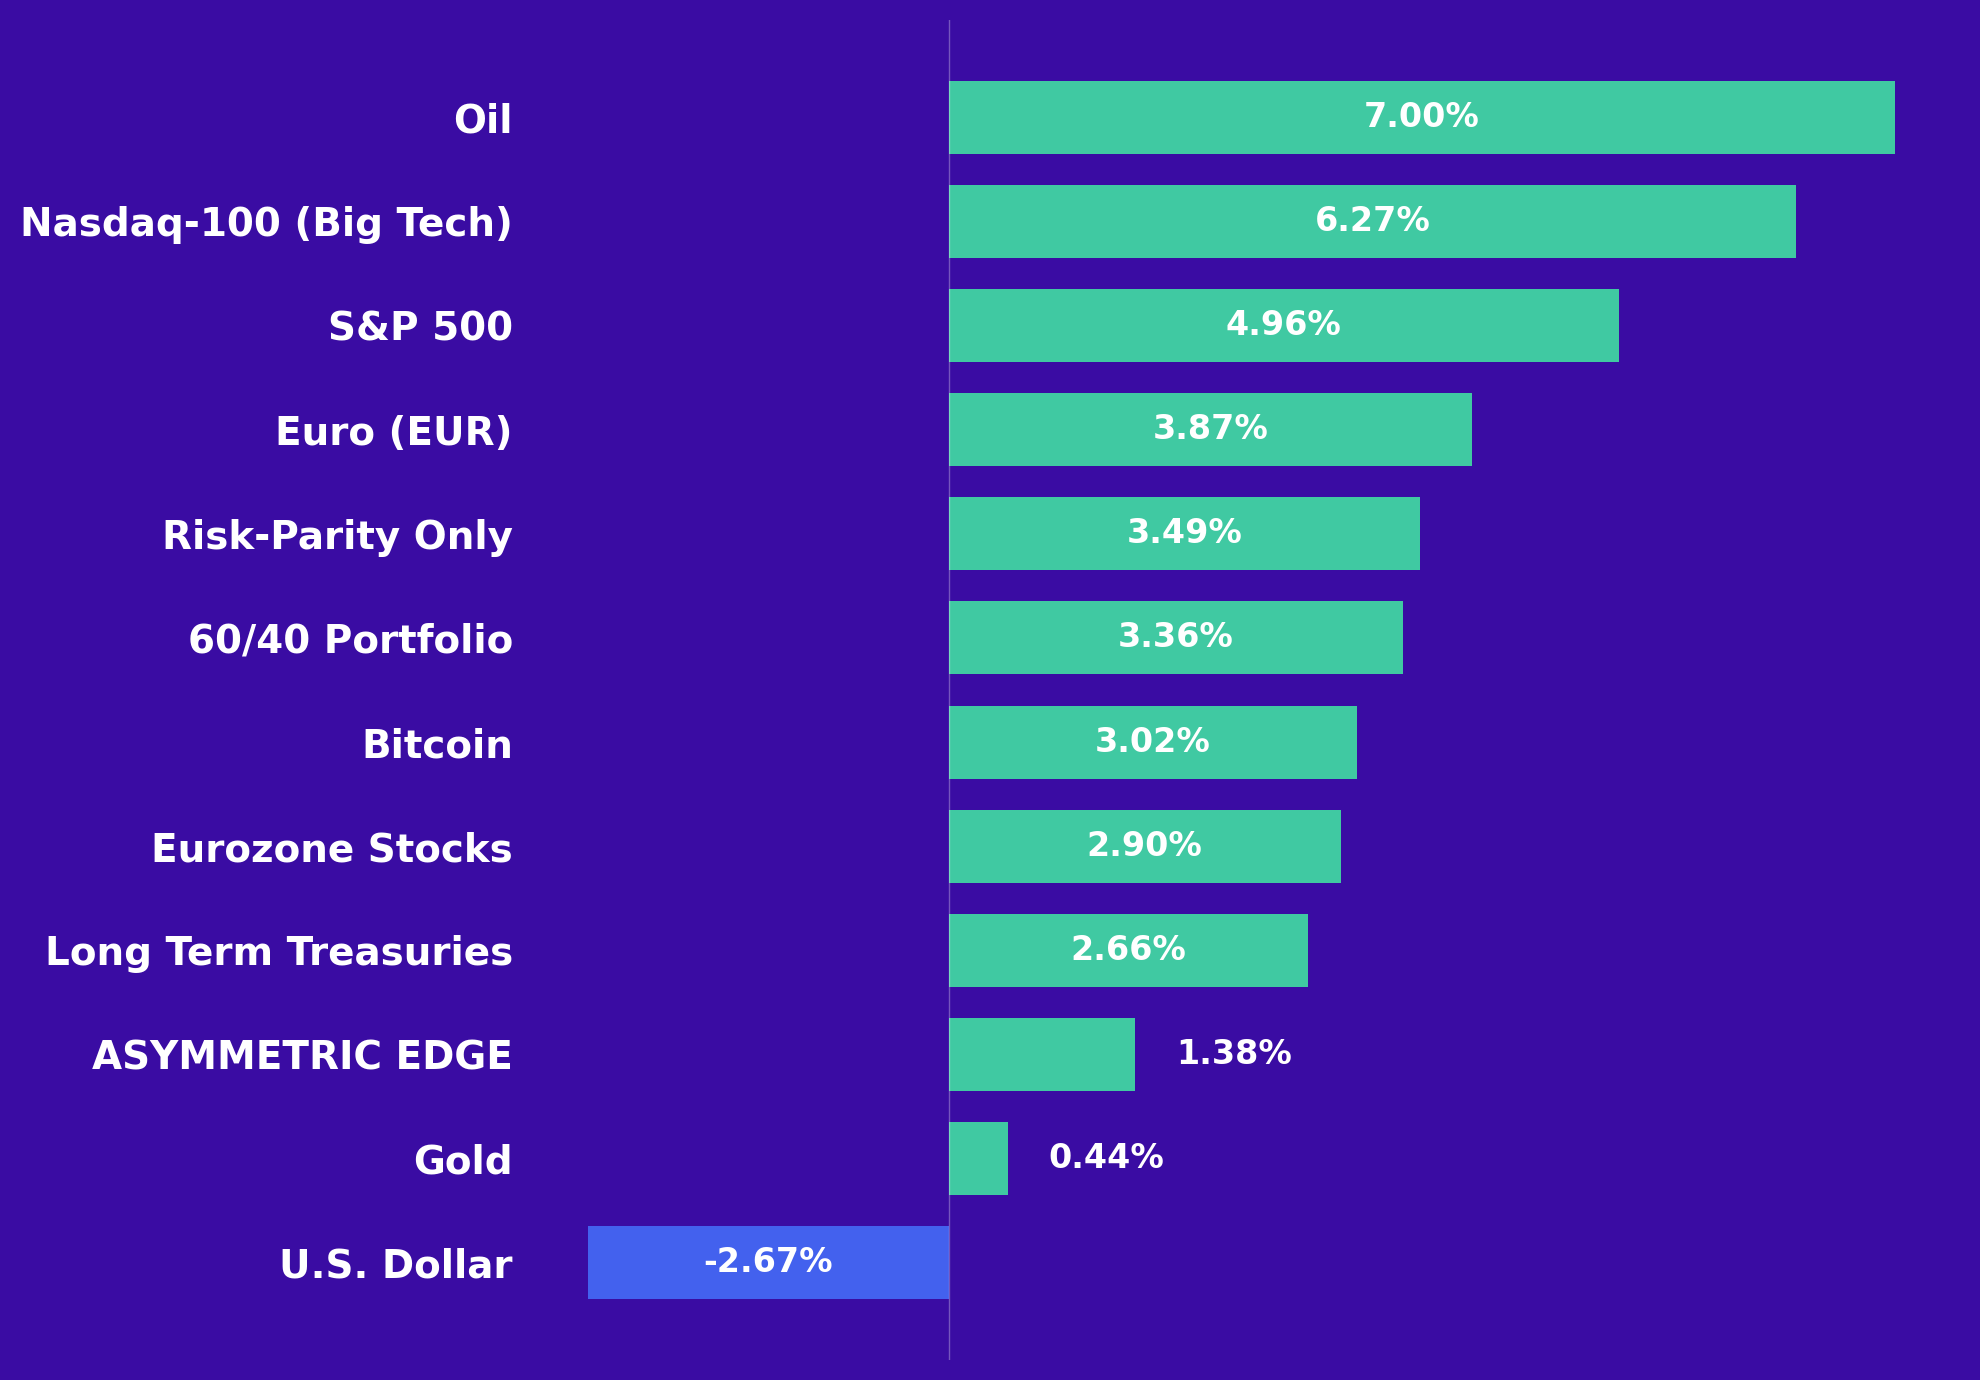
U.S. stock markets rose in June, with the S&P 500 up 5 percent and closing at record highs on optimism for trade deals with China and the UK, as well as expectations of a Fed rate cut.
Tech stocks led the gains, particularly in artificial intelligence and semiconductors, with the Nasdaq-100 climbing over 6 percent as investors favored big tech.
European equities were mixed, with broad indices falling just over 1 percent in June on concerns about U.S. tariffs and Middle East tensions.
But since the euro gained nearly 4 percent against the U.S. dollar, Americans investing in Europe still saw positive returns just shy of 3 percent after converting back to dollars, as currency gains more than offset the index’s slight drop.
In the bond market, the big news was the passage of the “One Big Beautiful Bill,” which makes tax cuts permanent and boosts federal spending, adding about 3 trillion dollars to the deficit over the next decade.
As a result, Treasury yields jumped, with the 10-year yield rising to around 4.35 percent in early July. Higher yields mean more expensive borrowing for things like mortgages and car loans, which can slow economic growth.
The U.S. dollar has remained weak this year, declining nearly 3 percent last month, largely because so much new money is being printed and pushed into the economy.
Gold ended June mostly flat, but logged a weekly gain going into early July as global risks and a weaker dollar encouraged buying. Ongoing central bank buying is helping push forecasts as high as $3,700 per ounce by year-end.
Bitcoin rose 4 percent in June to finish around $108,000. The cryptocurrency benefited from the slide in the dollar and a renewed "risk-on" mood among investors.
The Asymmetric Edge portfolio gained 1.4 percent, maintaining its positive streak.
Year-to-Date Returns
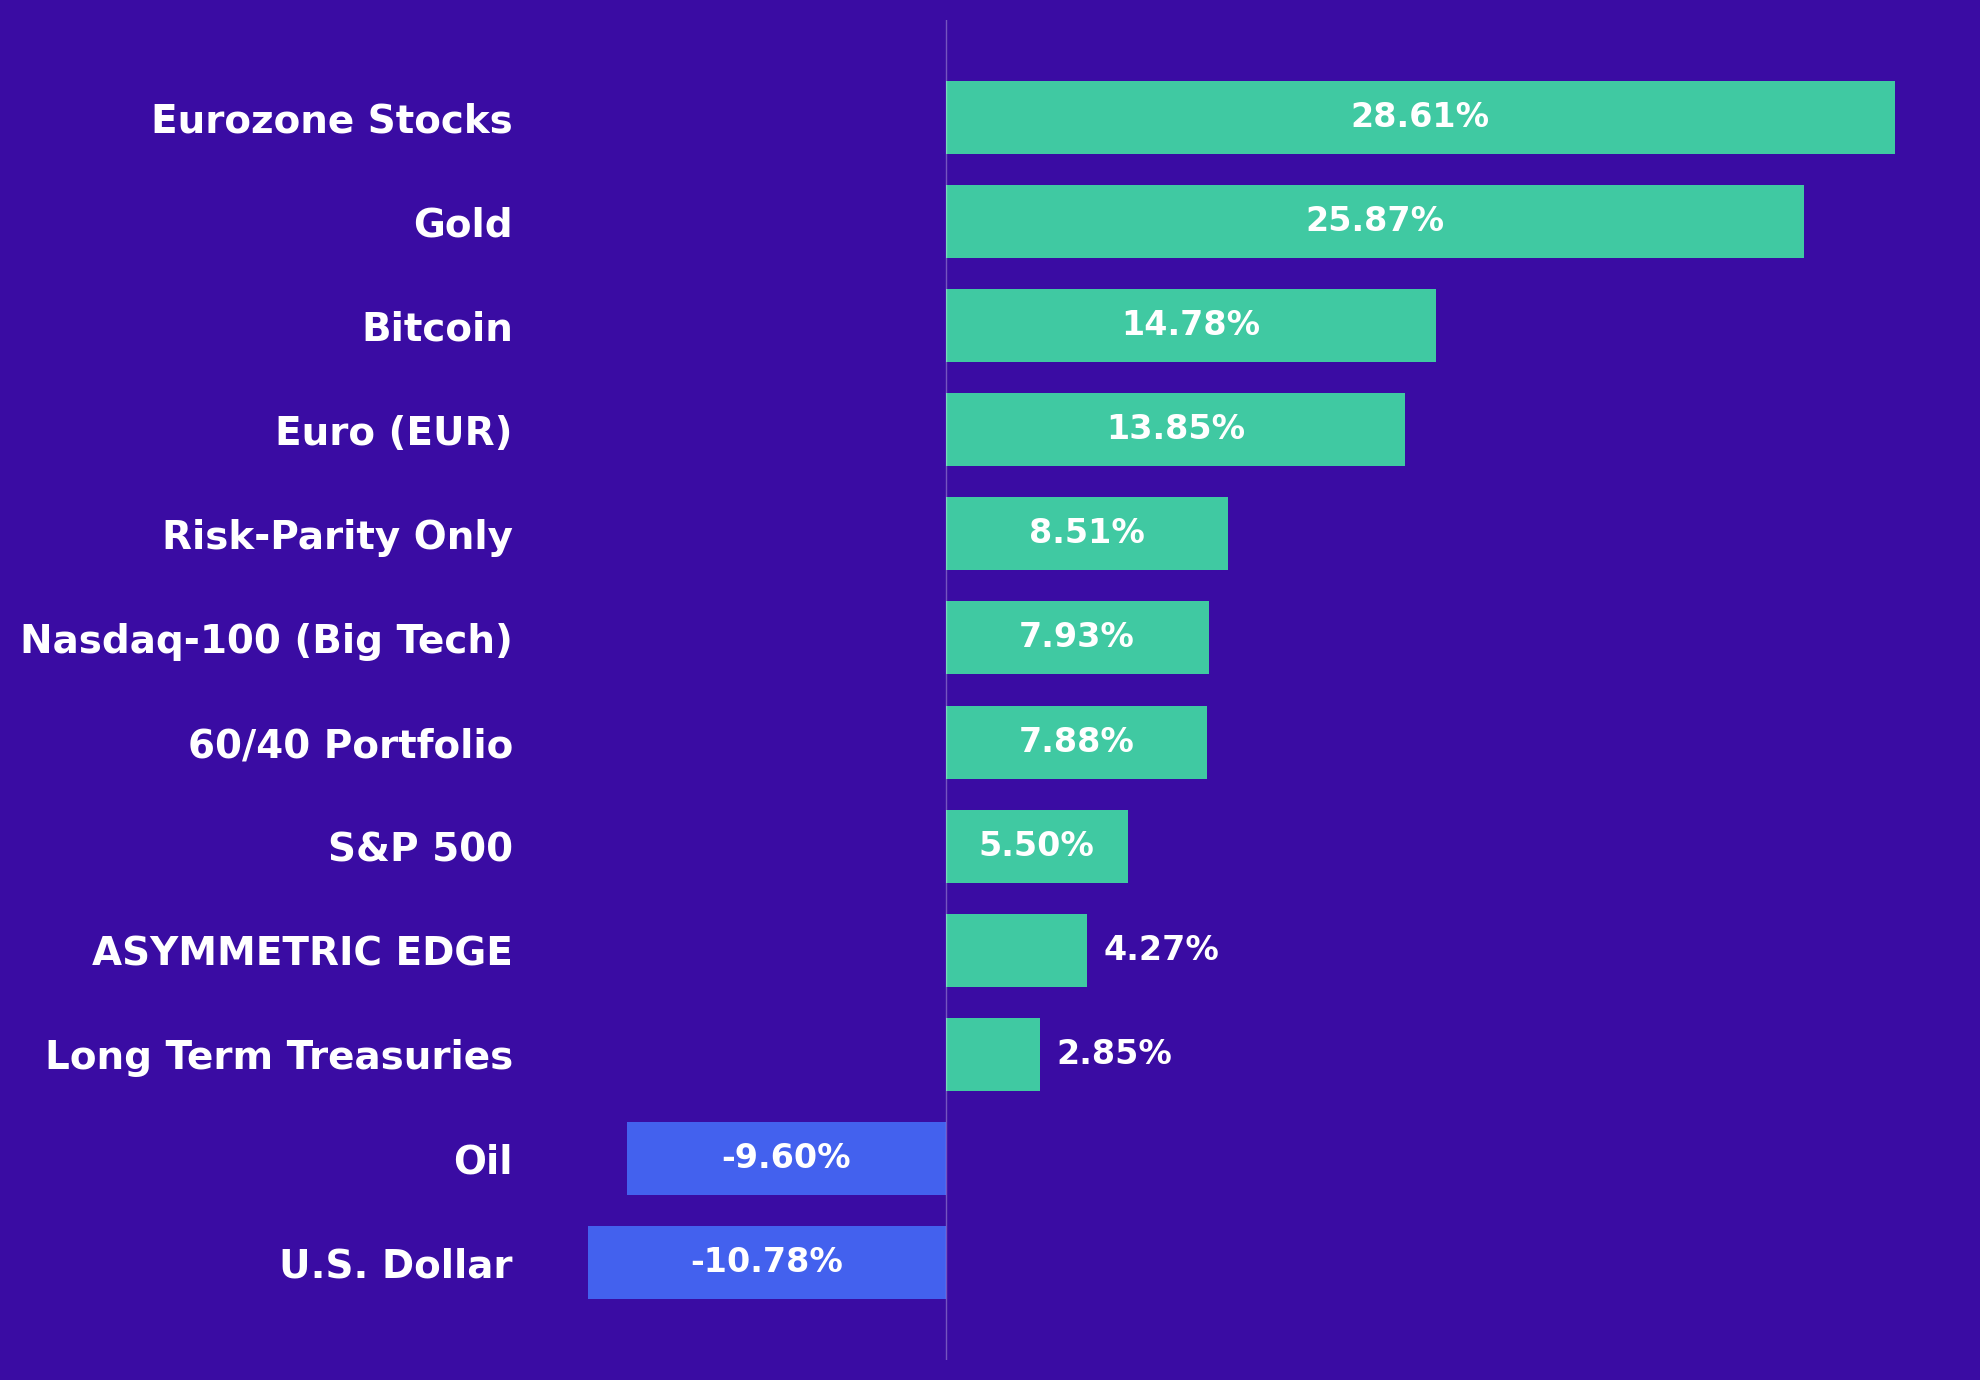
So far in 2025, Eurozone equities have led with a gain of nearly 29 percent, followed by Gold up 25 percent, reflecting strong equity momentum and demand for inflation hedges. Bitcoin has also performed well, rising almost 15 percent. The euro itself has advanced just shy of 14 percent, emphasizing broad euro-area strength.
Asymmetric Edge and Long-Term Treasuries are positive but modest at around 4 percent and 3 percent, respectively. Oil and the U.S. dollar are both down roughly 10 percent for the year.
Money Supply Growth and Stock Market Returns
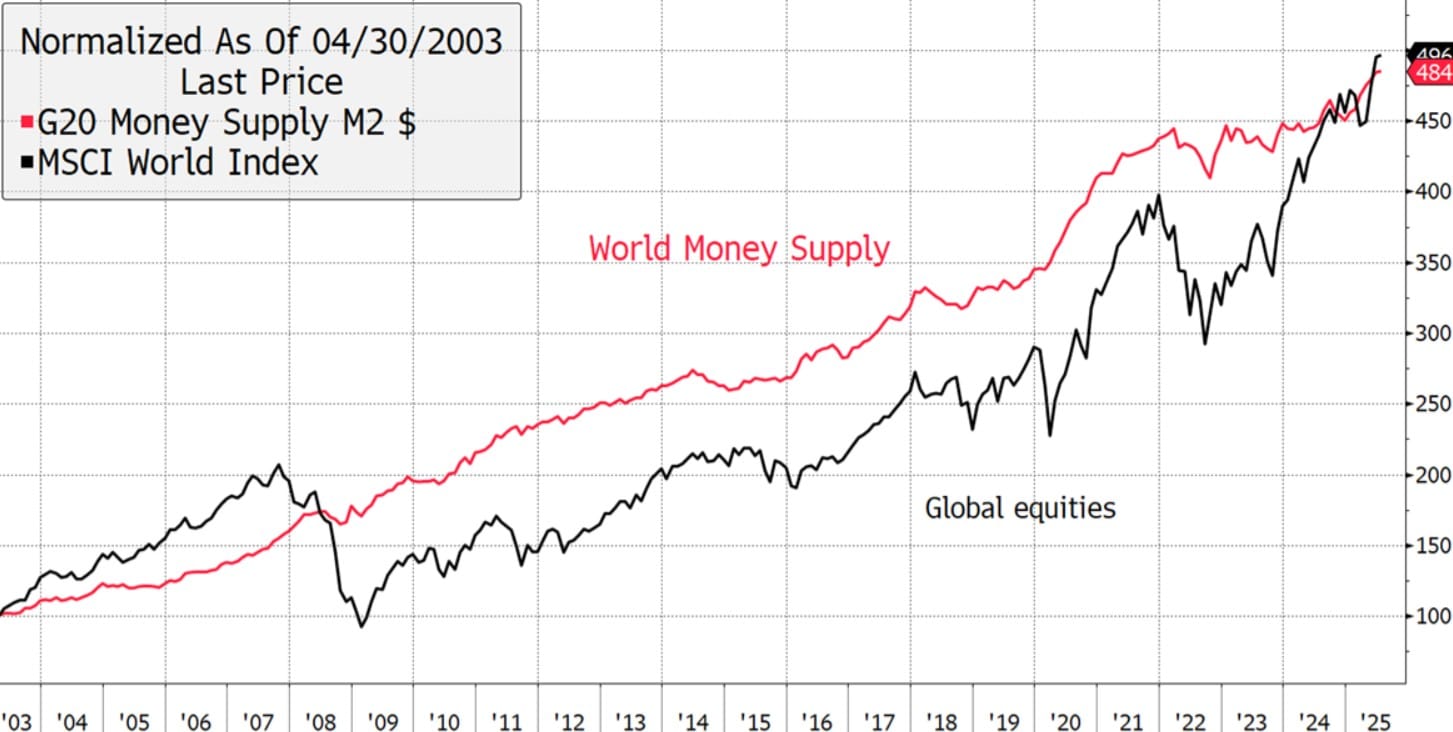
It's likely no coincidence that the money supply of the world’s 20 largest economies (the G20), now at $109 trillion, has grown right alongside global stock markets over the past 20 years.
The U.S government spends about 7 percent more than it collects in taxes and borrows the rest, putting extra dollars into the economy. The Federal Reserve can also create digital money to buy government debt, adding even more to the supply.
This flow of money and easy policy has pushed up prices in stocks, commodities, and digital assets. Having more dollars in circulation can weaken the dollar and increase risks of inflation and higher borrowing costs.
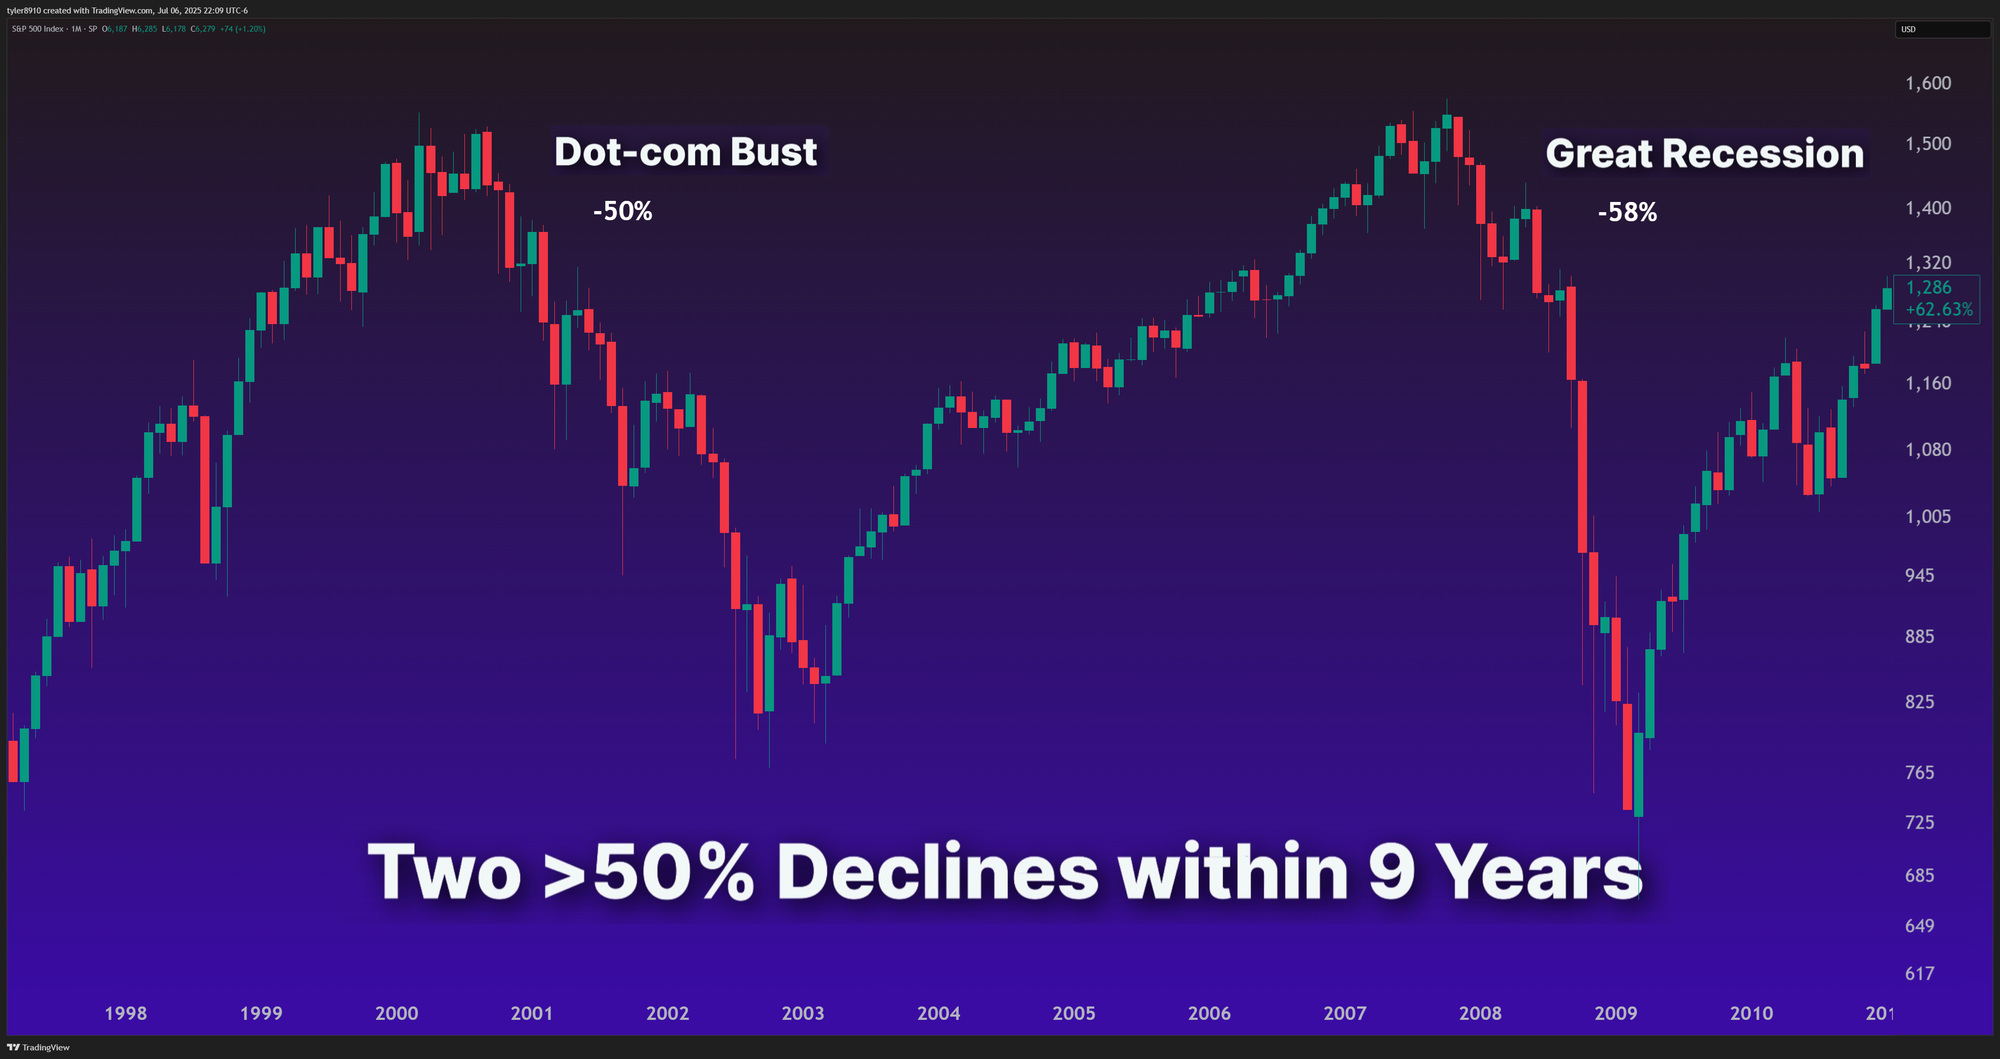
S&P 500 Chart Update
Source: TradingView
This month, I’m switching things up and sharing my chart analysis in video format. I recommend watching at 1.2x speed. Let me know what you think.
The main takeaway is that equity markets look bullish currently. Despite all the negative headlines and reasons for stocks to decline, my outlook is positive for now.
Don't let your opinion of what should happen, bias your trading strategy. - Marty Zweig
Why Focus on the S&P 500?
The index represents nearly 50 percent of all stocks globally. It tracks 500 major U.S. companies, with larger companies having more influence on index movements.
Investing is easy with exchange-traded funds (ETFs) that follow the S&P 500. By purchasing a single ETF, your money is automatically spread across all the companies in the index.
Why do I analyze, but not trade this index? Its popularity and size have allowed me to develop several useful indicators that give me a slight edge in assessing market direction. These insights often apply to other markets like the Nasdaq-100 and Eurozone stocks, which I find more effective for expressing my investment views.
Staying the Course
When your account is red and the news is overwhelmingly negative, having a clear investment strategy is invaluable. Without well-defined rules, I would be constantly second-guessing myself and likely get scared out of the market.
Instead, following a backtested approach that rotates into the strongest, least-correlated assets within a balanced, risk-aware portfolio has made a big difference for me.
It’s about earning pretty good returns that you can stick with and which can be repeated for the longest period of time. That’s when compounding runs wild. - Morgan Housel in The Psychology of Money
I don't know how people with most of their money in stocks handle it. Being fully invested in the S&P during 2008 and seeing a 57 percent decline would've been crushing.
U.S. stocks have done well for the past 15 years, but I would not want to miss out on the bull runs in gold and bitcoin happening now.
Psychologically, losses are twice as powerful as gains. A portfolio decline of 10 percent always feels worse than the satisfaction of gaining 10 percent.
It’s hard to know your true risk tolerance until you’ve lived through it. The approach I developed is the result of learning what I can handle through hard-won experience.
In backtests since 1993, the Asymmetric Edge strategy's maximum drawdown was just 12.5 percent, compared to 51 percent for the S&P 500 during the same period. Having a system that's equipped to play both offense and defense matters a lot to me.
Backtested results are hypothetical and do not reflect actual investment outcomes.
Strategy Update
Eurozone ETF

After introducing the iShares MSCI Eurozone ETF (EZU) last month, it held its ground, providing a modest 2.71 percent return after factoring in the euro’s gains against the dollar. Without the favorable exchange rate, European indices (ESTX50) ended the month slightly down.
In last month's newsletter, you'll recall my dual reasons for adding EZU, which was for European stock exposure and, importantly, euro exposure. That latter reason played out well last month.
The fund also paid out a large biannual dividend of $1.218 per share or 2 percent annualized. For someone with an account size of $250,000 and based on last month's EZU allocation percent, that would've equated to a dividend of roughly $1,350.
More Upside for the Euro?
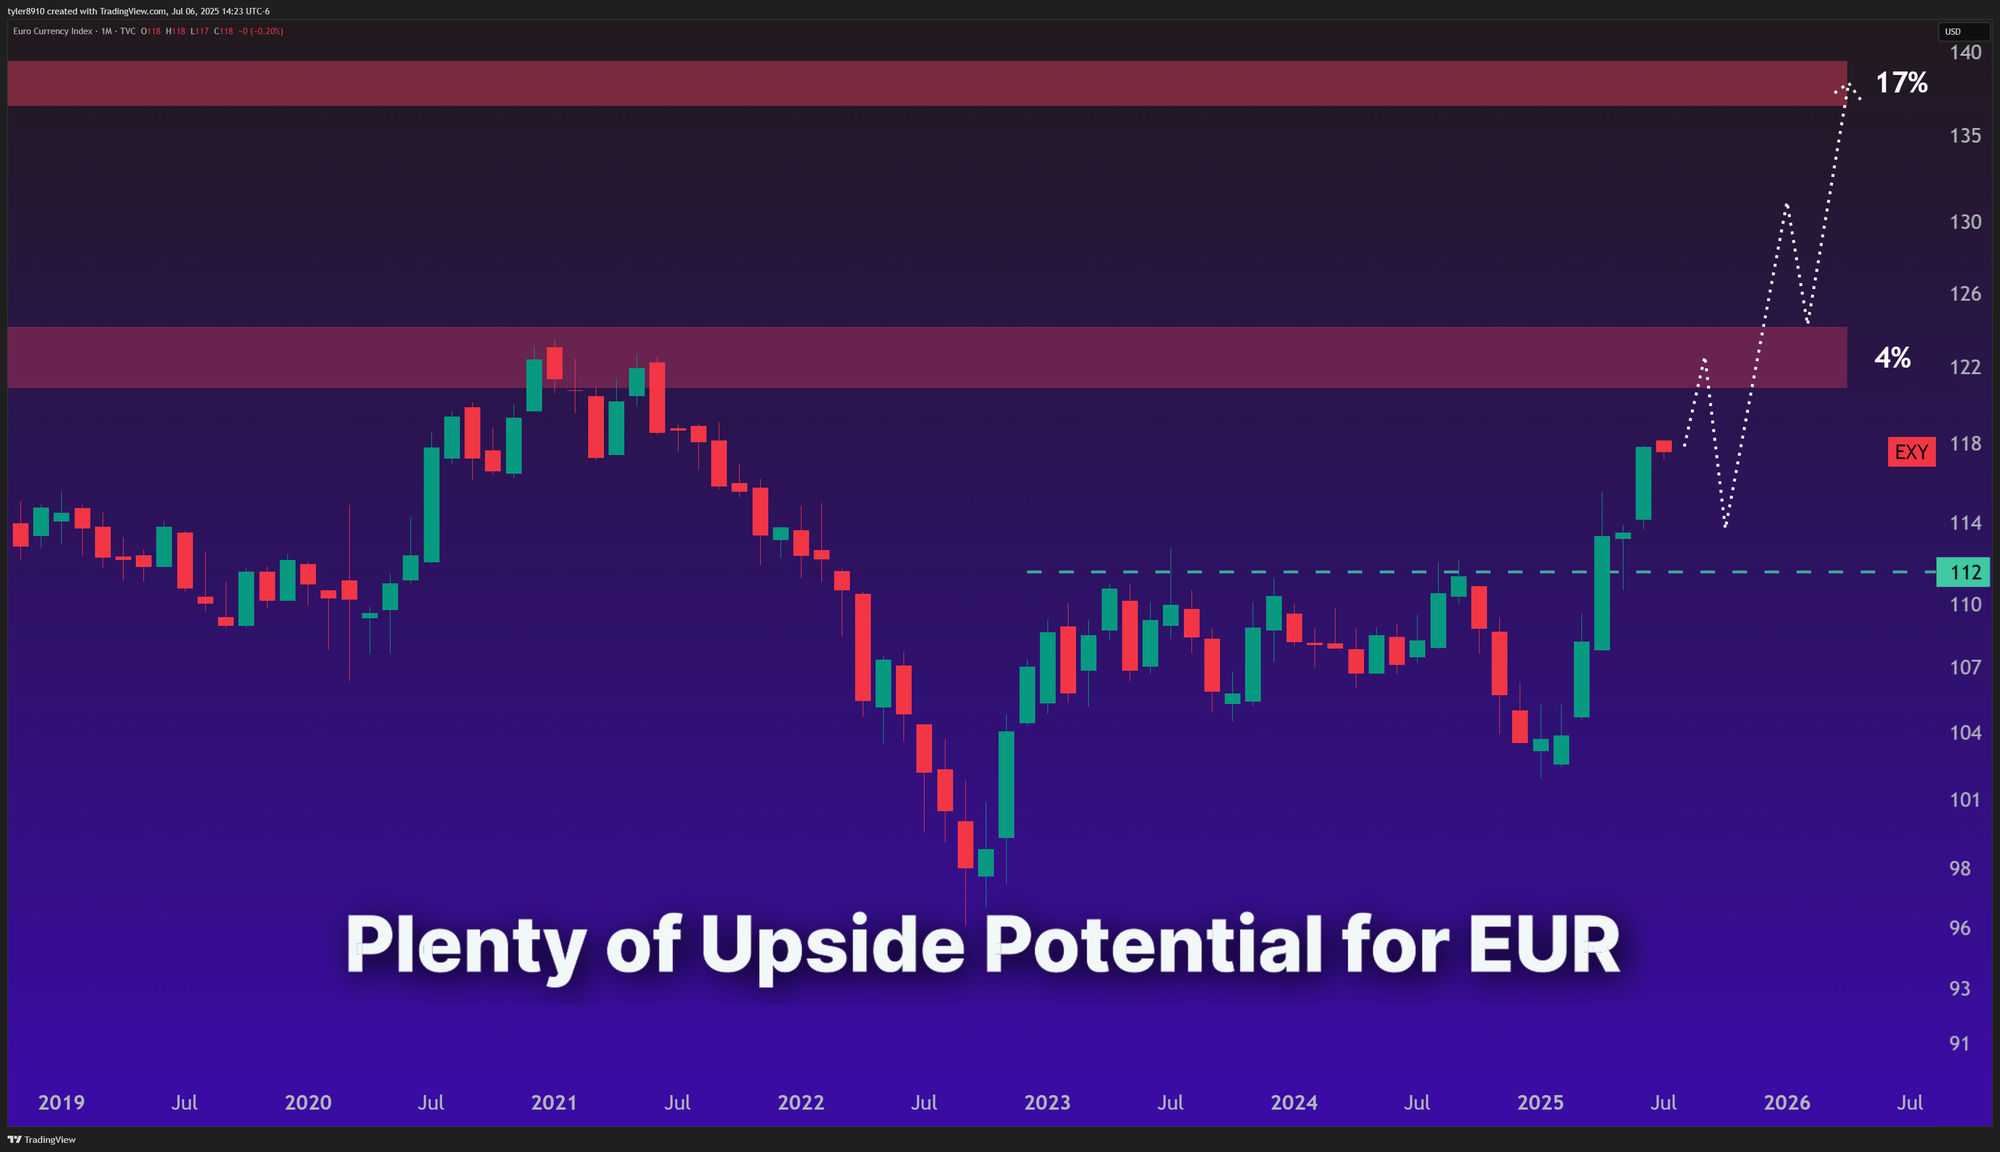
The euro posted another strong month. The chart above highlights possible resistance levels ahead. From here, a further 4 percent rally over the next several months—and even as much as 17 percent over the next year—looks reasonable.
While the euro has strengthened, the U.S. dollar tells a different story.
U.S. Dollar Chart Moves
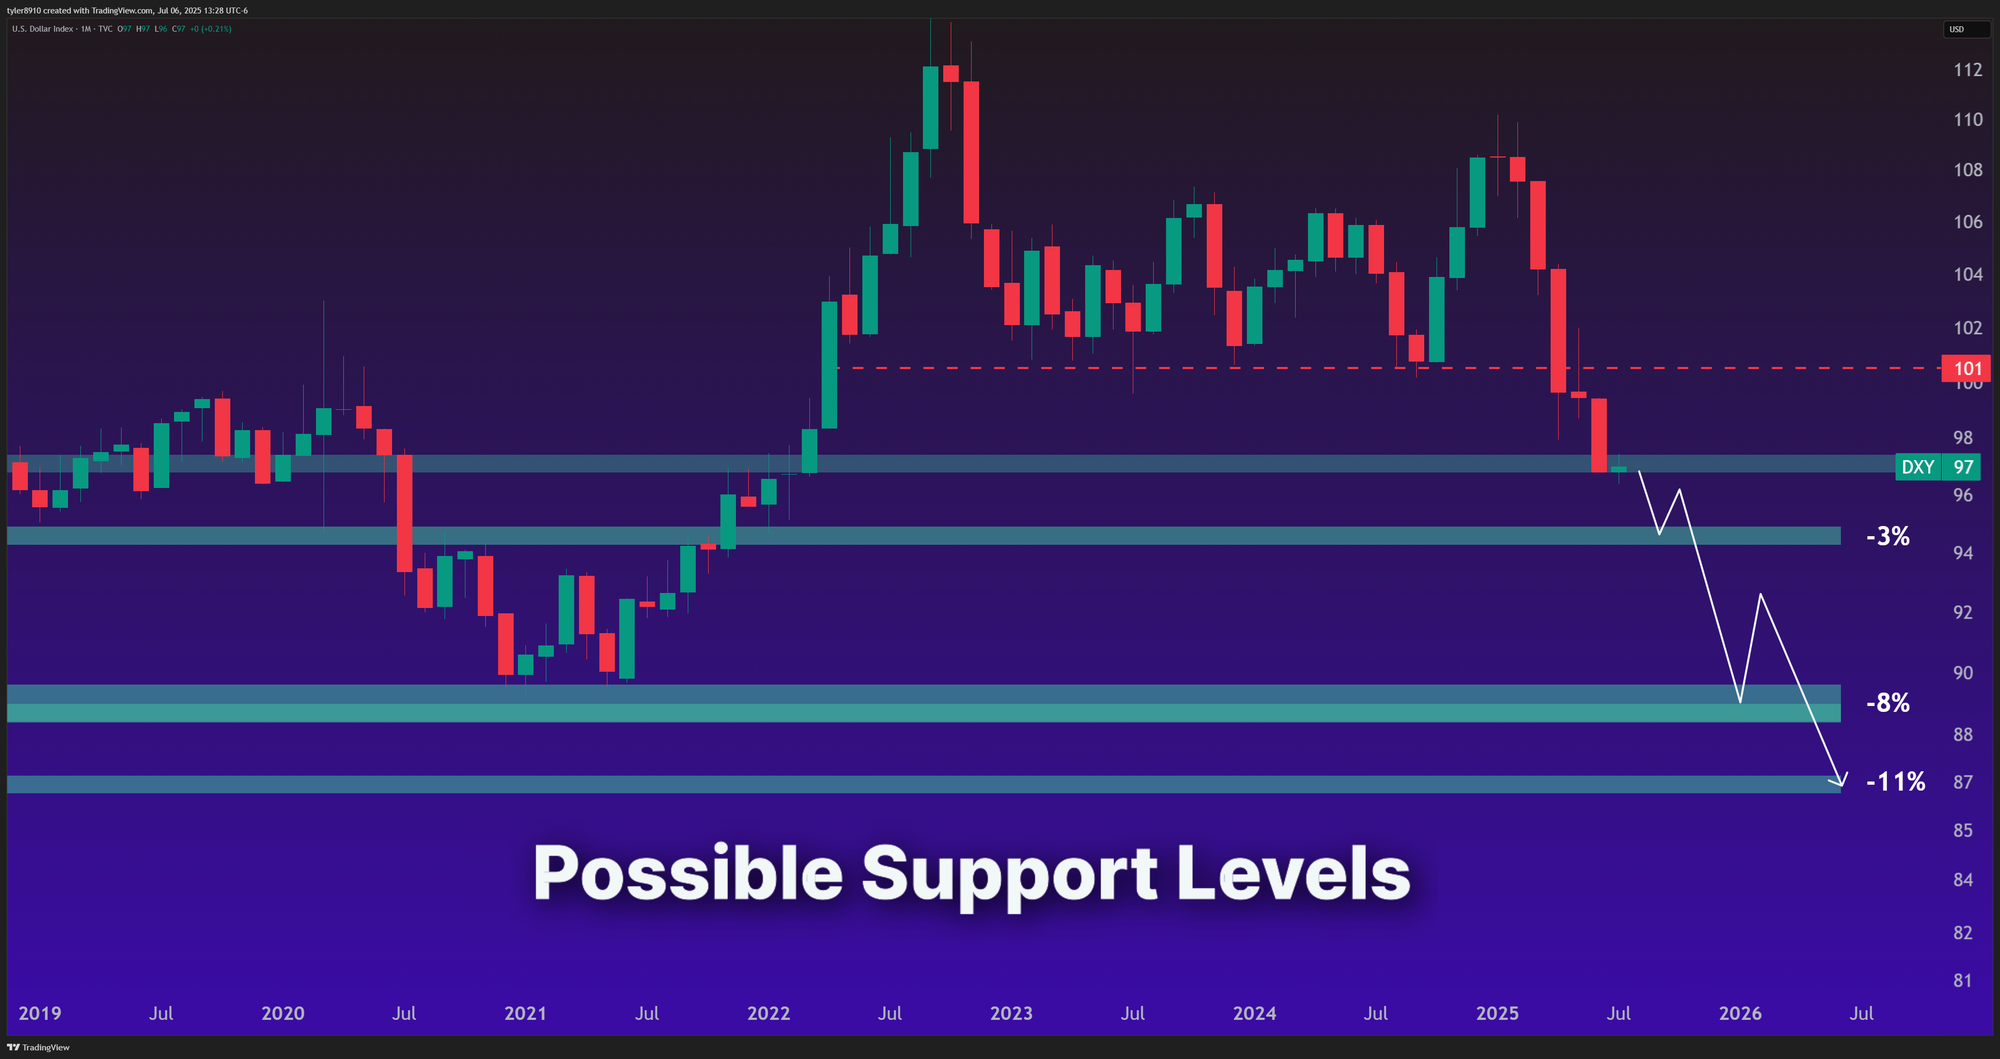
The dollar continues to decline. I’ve updated the DXY chart above to show potential support levels as it moves lower. I can easily see the dollar falling another 8 percent from current levels over the next year.
July's Portfolio Allocations
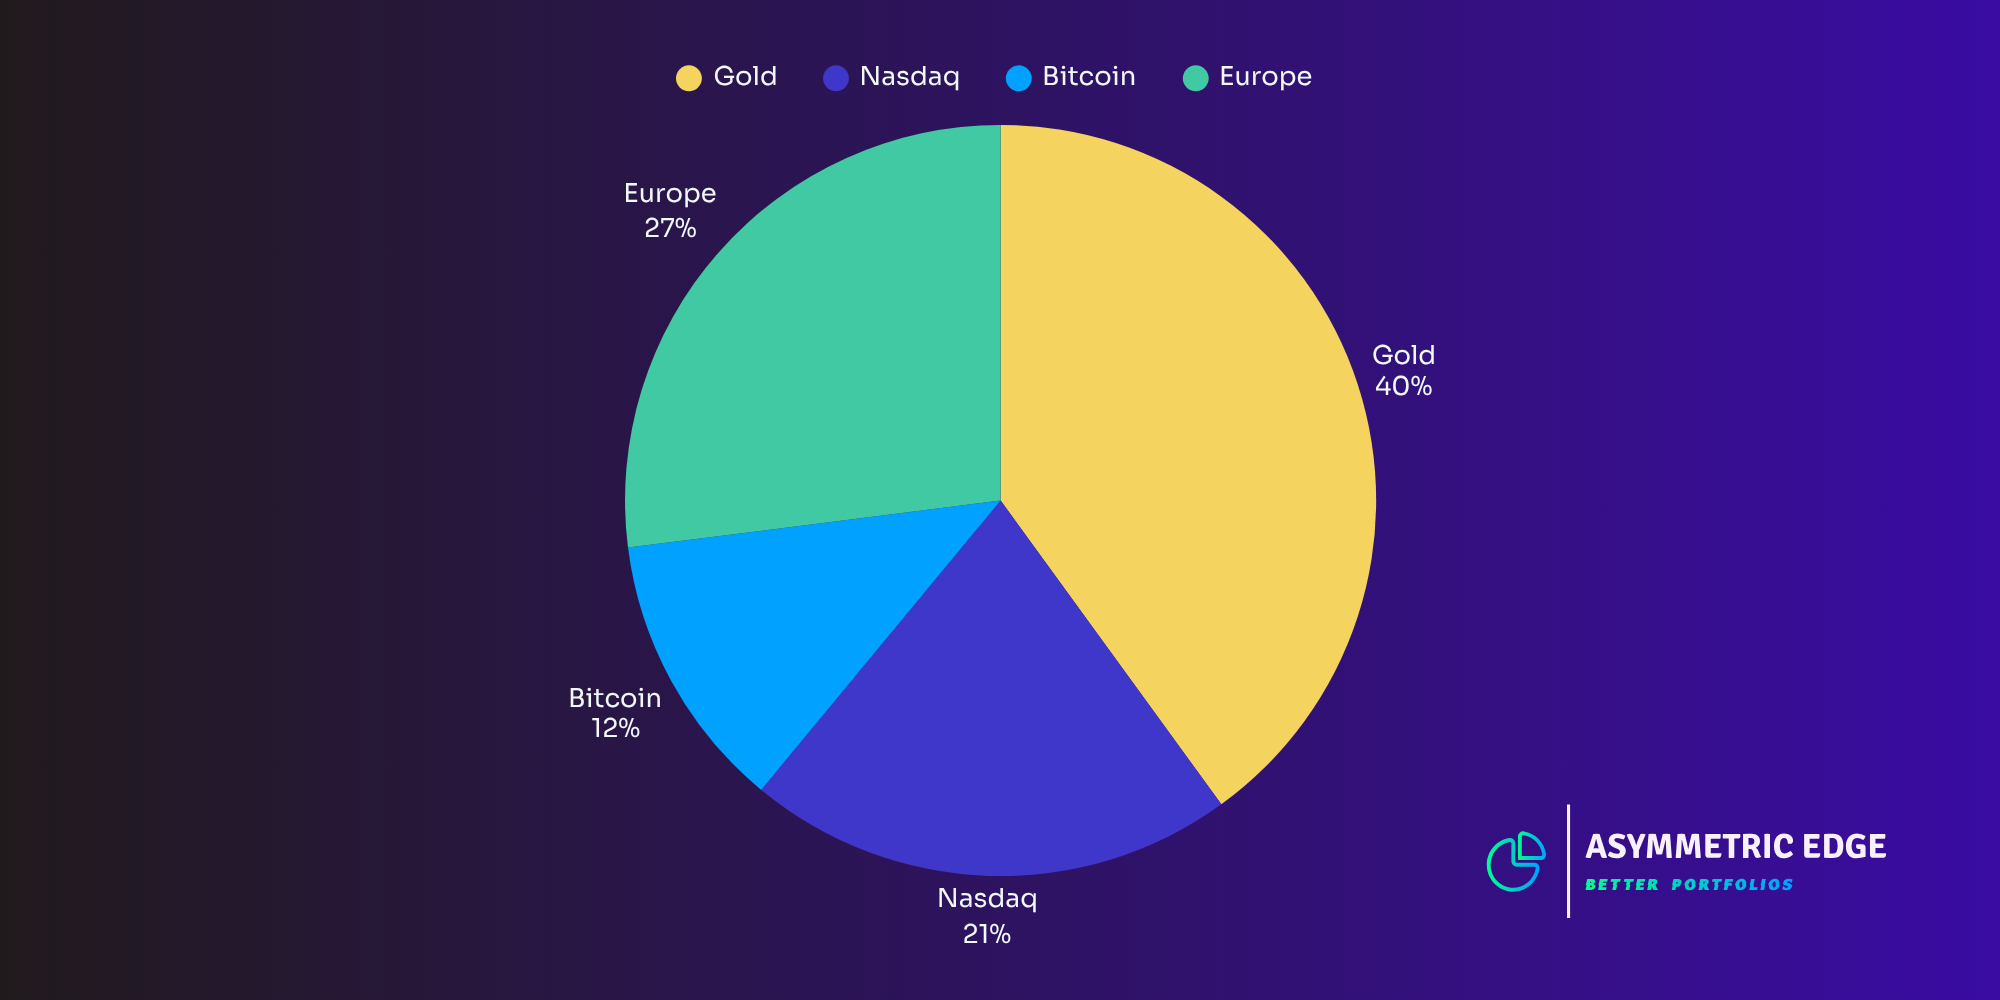
This month, asset allocations are very similar to last month:
- GLD (Gold): 39.93%
- EZU (Eurozone): 26.57%
- QQQ (Nasdaq-100): 21.42%
- IBIT (Bitcoin): 12.08%
Purchasing Shares
Here's a link to the Google Sheet I use to rebalance my portfolio. The spreadsheet pulls live ETF prices and helps me calculate how many shares to buy or sell based on the data provided.

Calculator Terms of Use
This tool is for my personal use and shared for informational purposes only. While I strive to ensure accuracy, I make no representation or warranty as to its accuracy or completeness. Users should verify all calculations independently. Please consult your own advisor before using similar tools.
Beyond the typical asset classes, I've been watching the uranium market.
One Final Chart

Since 2016, uranium prices have climbed more than 300 percent, fueled by renewed interest in nuclear energy. The Sprott Uranium Miners ETF (URNM) has posted comparable gains over the same period.
This growth comes as more countries restart or keep existing nuclear plants running and as new, smaller reactors are planned. Tech companies like Microsoft and Meta are also fueling demand, seeking reliable energy for AI and data centers.
For context, Meta, the parent company of Facebook, has tripled its energy use since 2019.
There's growing support for nuclear power as essential for addressing climate change because it doesn't emit greenhouse gases and can provide steady power when renewables fall short.
Challenges remain, including high costs, long construction times, nuclear waste, and safety concerns. Still, as electricity demand rises, especially from AI, more companies and governments are turning to nuclear as a solution.
This newsletter is for informational purposes only and should not be considered as investment advice or a recommendation of any particular security, strategy, or investment product. The information contained herein has been obtained from sources believed to be reliable, but its accuracy and completeness are not guaranteed. Opinions expressed are subject to change without notice. This material is not an offer to sell or a solicitation of an offer to buy any security.
The author may hold positions in securities mentioned in this newsletter. All expressions of opinion are subject to change without notice in reaction to shifting market conditions. Data contained herein from third-party providers is obtained from what are considered reliable sources. However, its accuracy, completeness, or reliability cannot be guaranteed.
Investment involves risk, including possible loss of principal. No investment strategy or risk management technique can guarantee returns or eliminate risk in any market environment.