Trade Tensions & Market Defense


April was a wild month. Instead of rehashing all the headlines, I’ll focus on the most important market-moving highlights.
Trade tensions escalated, with Trump imposing tariffs on a wide array of countries. China got hit hardest with 145% duties on imports. Trade with China has been severely disrupted, prompting warnings from retailers about significant inventory shortages. Analysts caution that if current trade policies persist, consumers could face empty shelves and rising prices as early as late May.

The odds of a U.S. recession have risen significantly, with Goldman Sachs and J.P. Morgan increasing their estimates to 45% and 60%, respectively. Despite increased recession odds, the Federal Reserve is taking a cautious approach, leaving benchmark rates between 4.25% and 4.5%.
In April, oil dropped nearly 19% due to recession fears. OPEC announced an increase in output, applying further pressure on prices.
I was grateful to be watching from the sidelines, with most of my portfolio safely parked in T-bills, considering all the market chaos. While major indices managed to recover and end the month mostly flat, the wild swings showed why staying defensive proved beneficial.
April Asset Performance
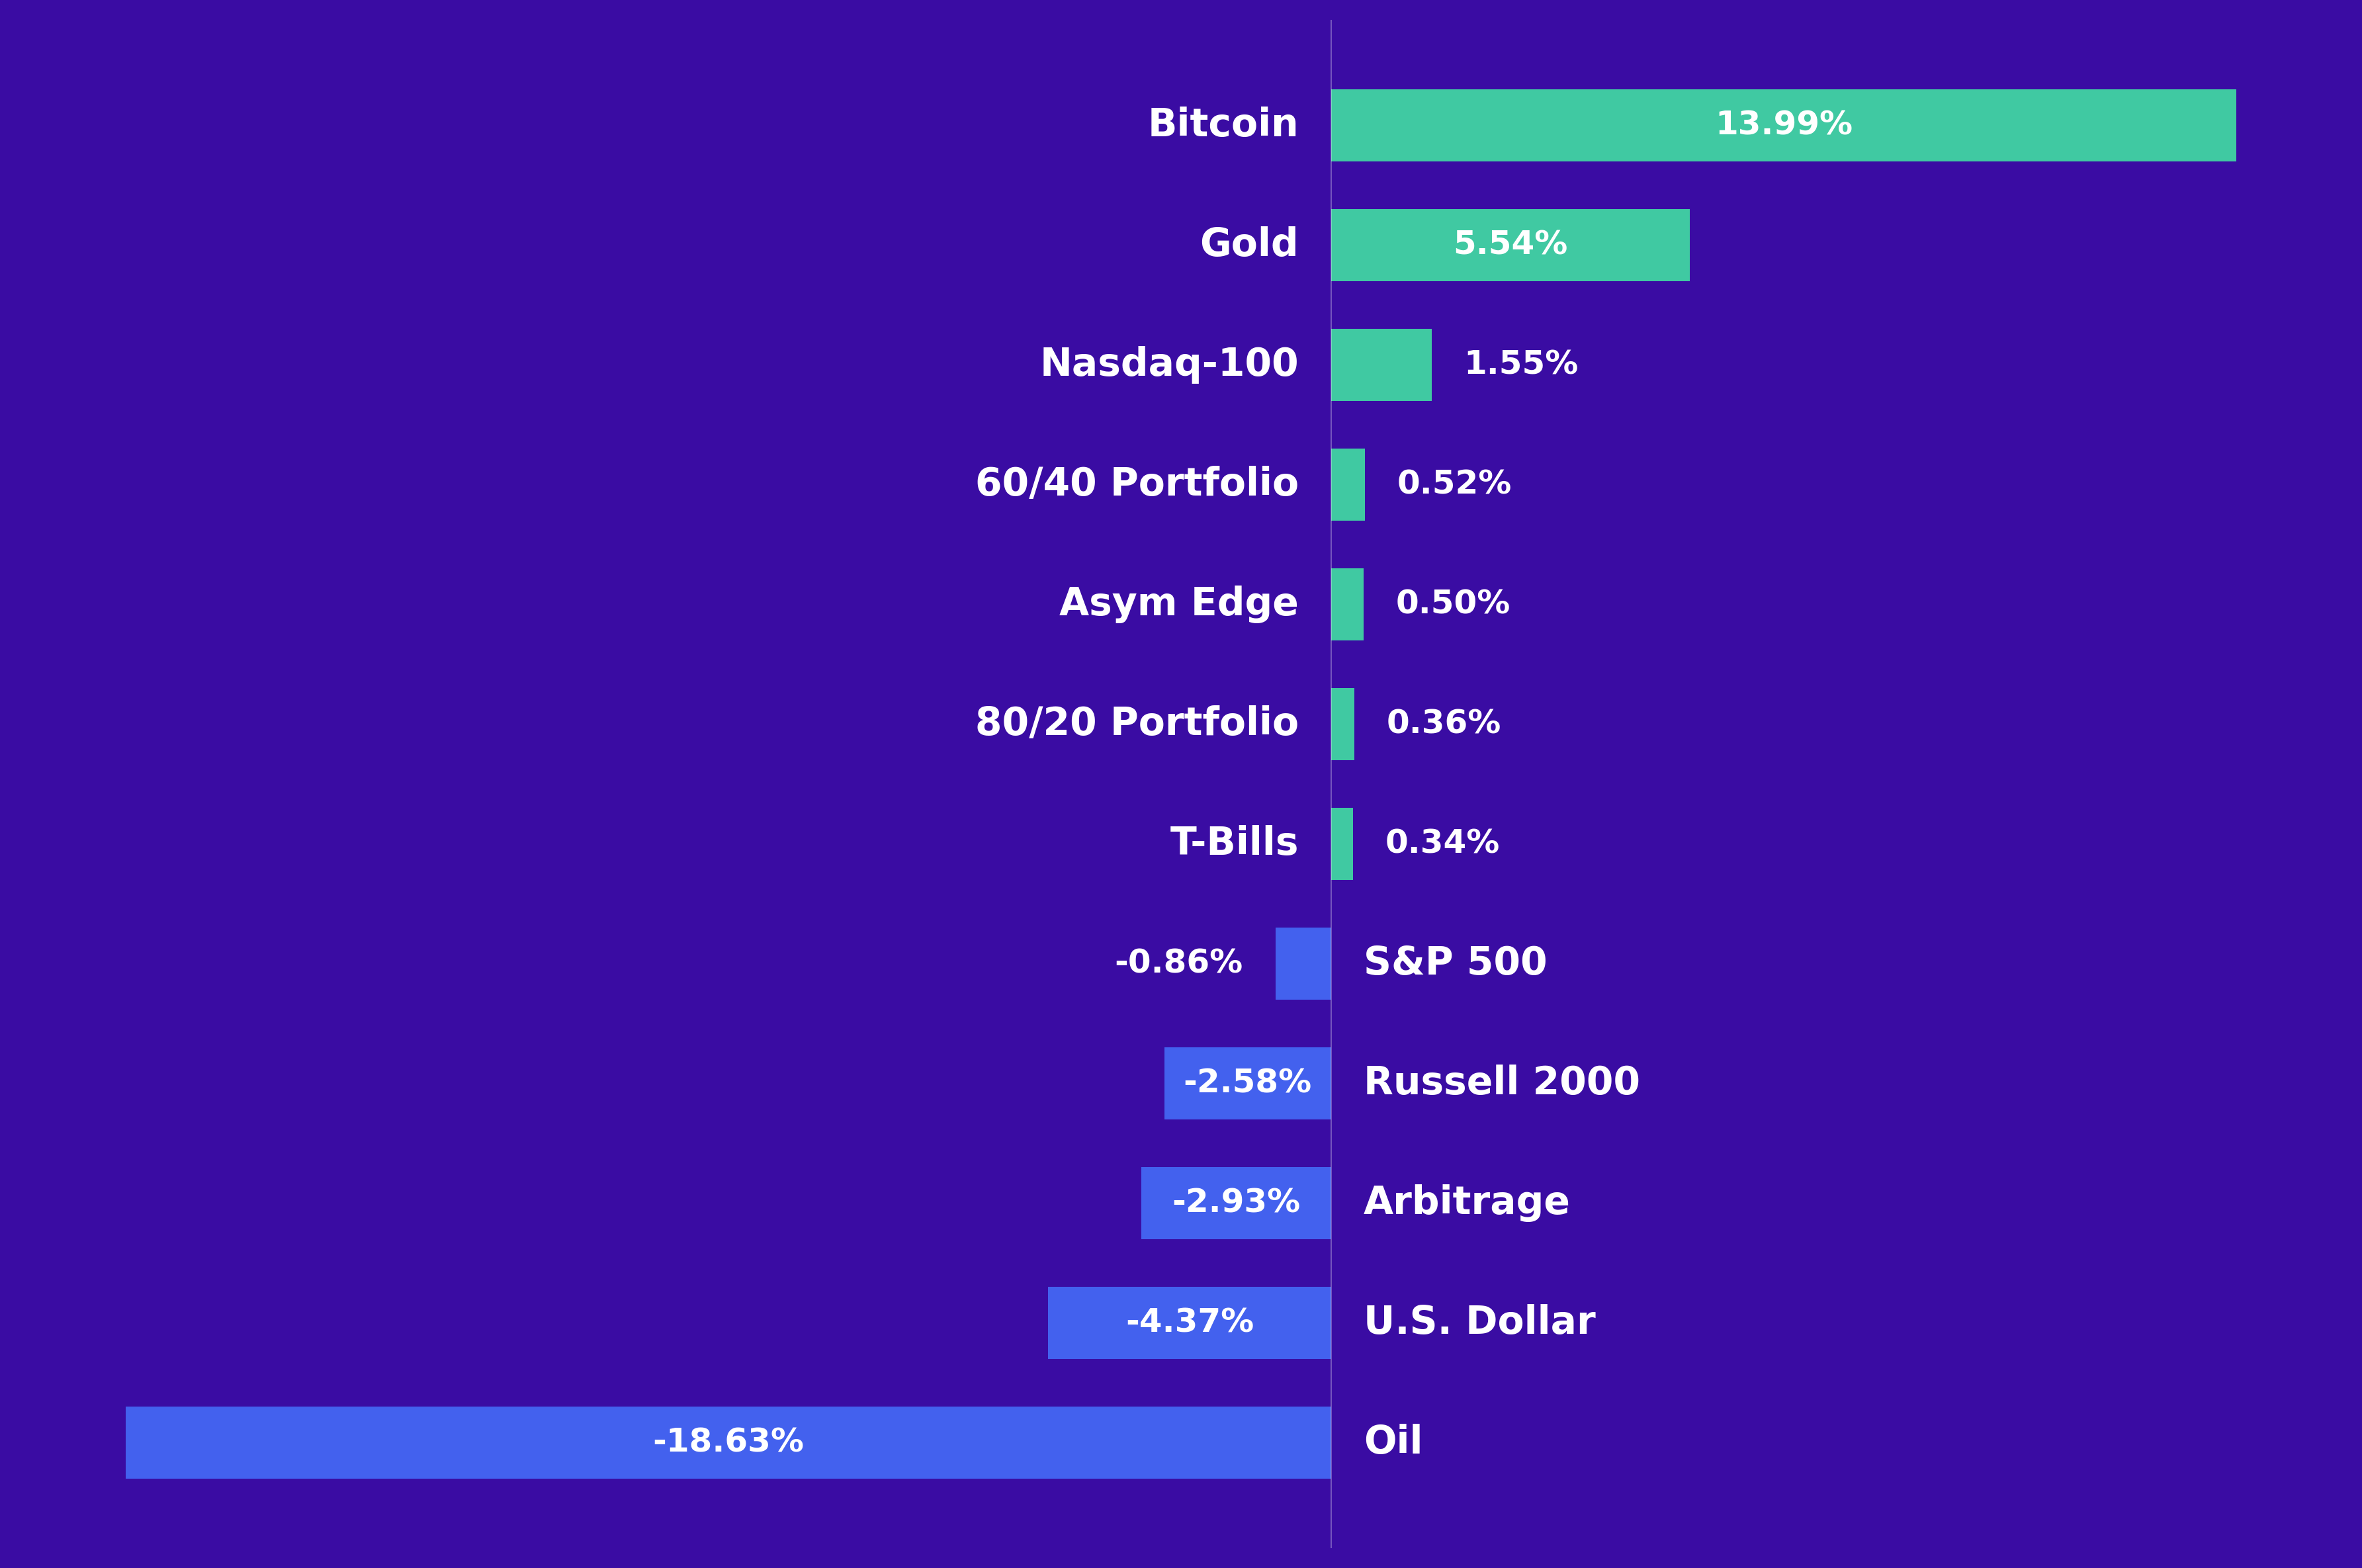
The strategy portfolio navigated April's market turbulence well, delivering a steady 0.50% return with low volatility. This stability stood in sharp contrast to a traditional 60/40 portfolio which delivered essentially the same return, but with much greater risk, declining by over 7% at one point. The S&P 500 ended the month down 0.86%, recovering from a nearly 12% drawdown on April 7th.
In April, safe-haven assets were strong, with Gold climbing 5.54%. Bitcoin emerged as the month's standout performer, gaining 14%, supported by broader institutional adoption through spot ETFs and increased interest amid dollar weakness.
Asset Spotlight
The U.S. Dollar
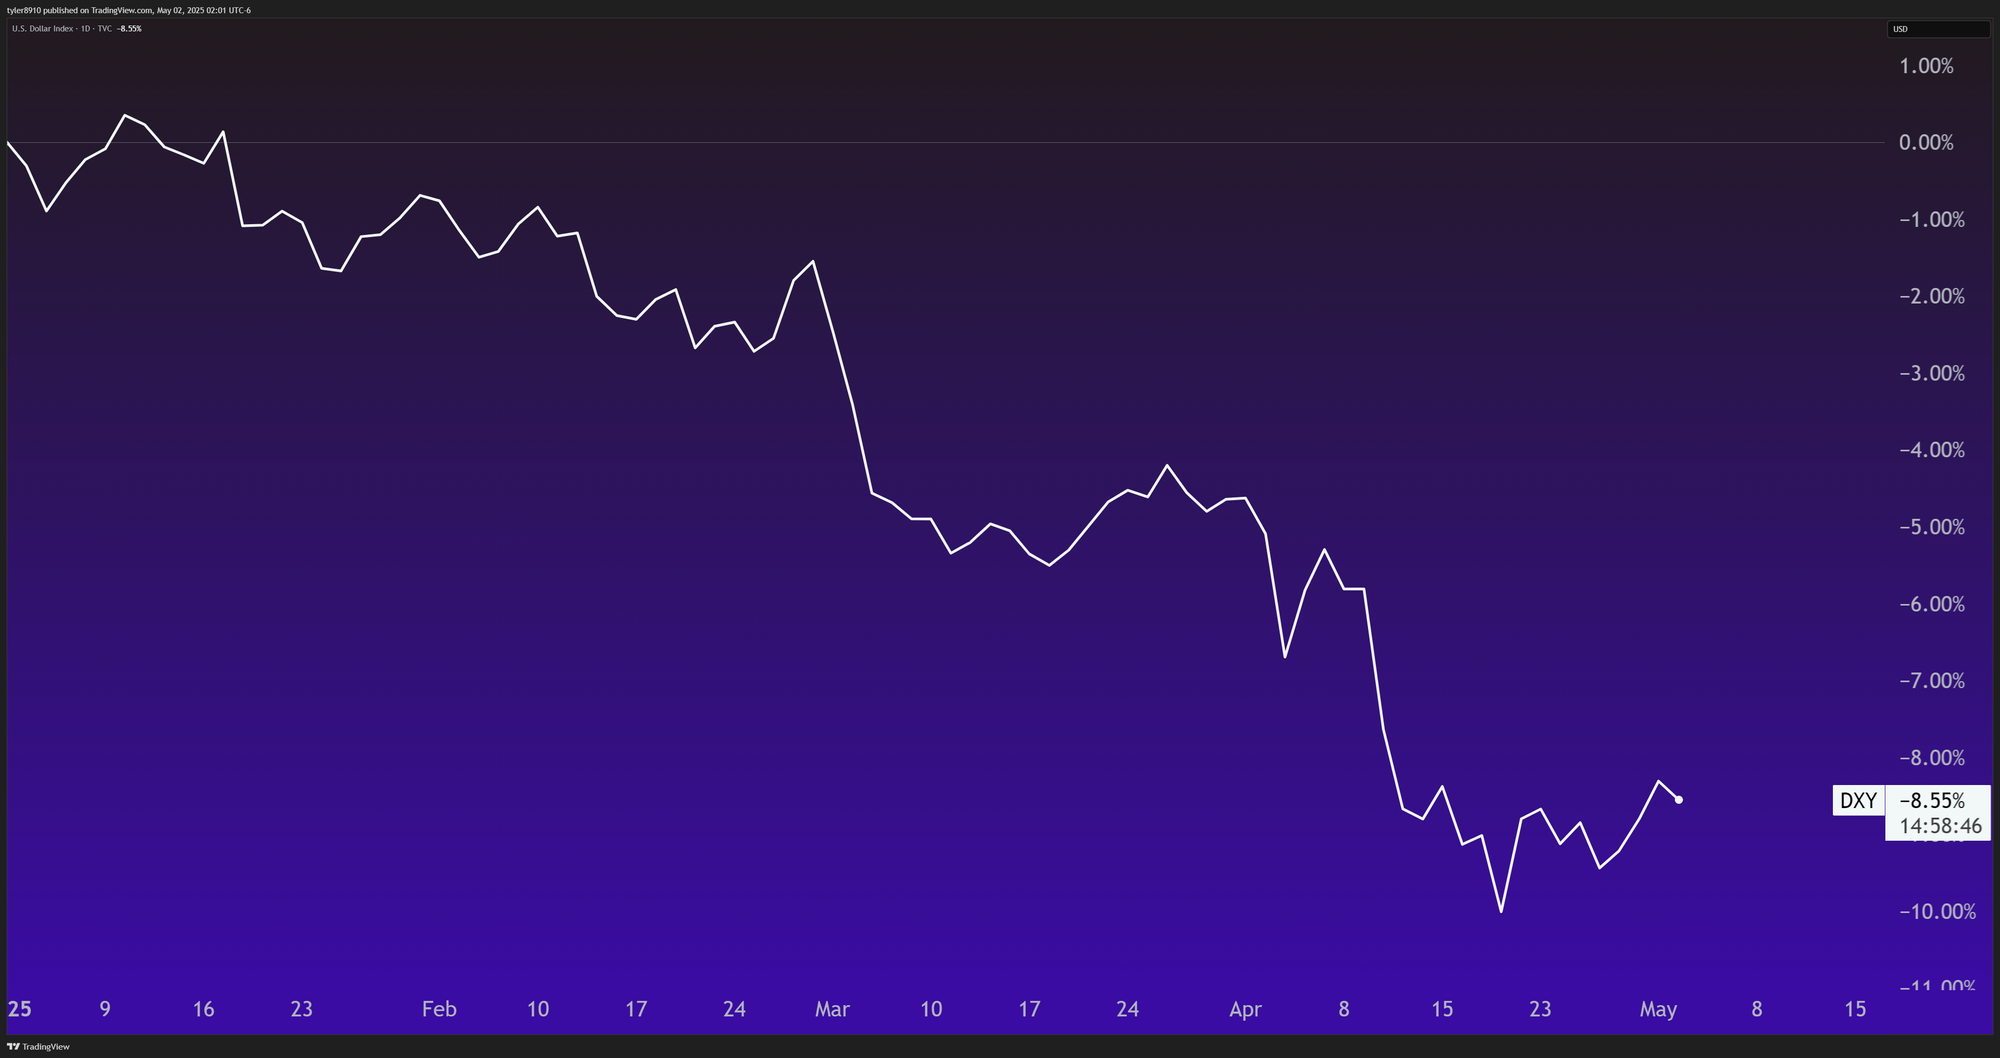
The dollar has declined -8.55% YTD and -4.12% in April. The U.S. Dollar Index (DXY) measures its value against six major foreign currencies, with the euro having the largest weight. It's a useful gauge of Americans' global purchasing power.
A weaker dollar has mixed implications:
- Challenges: Costlier imports and international travel.
- Benefits: Increases U.S. exports and draws foreign investment.
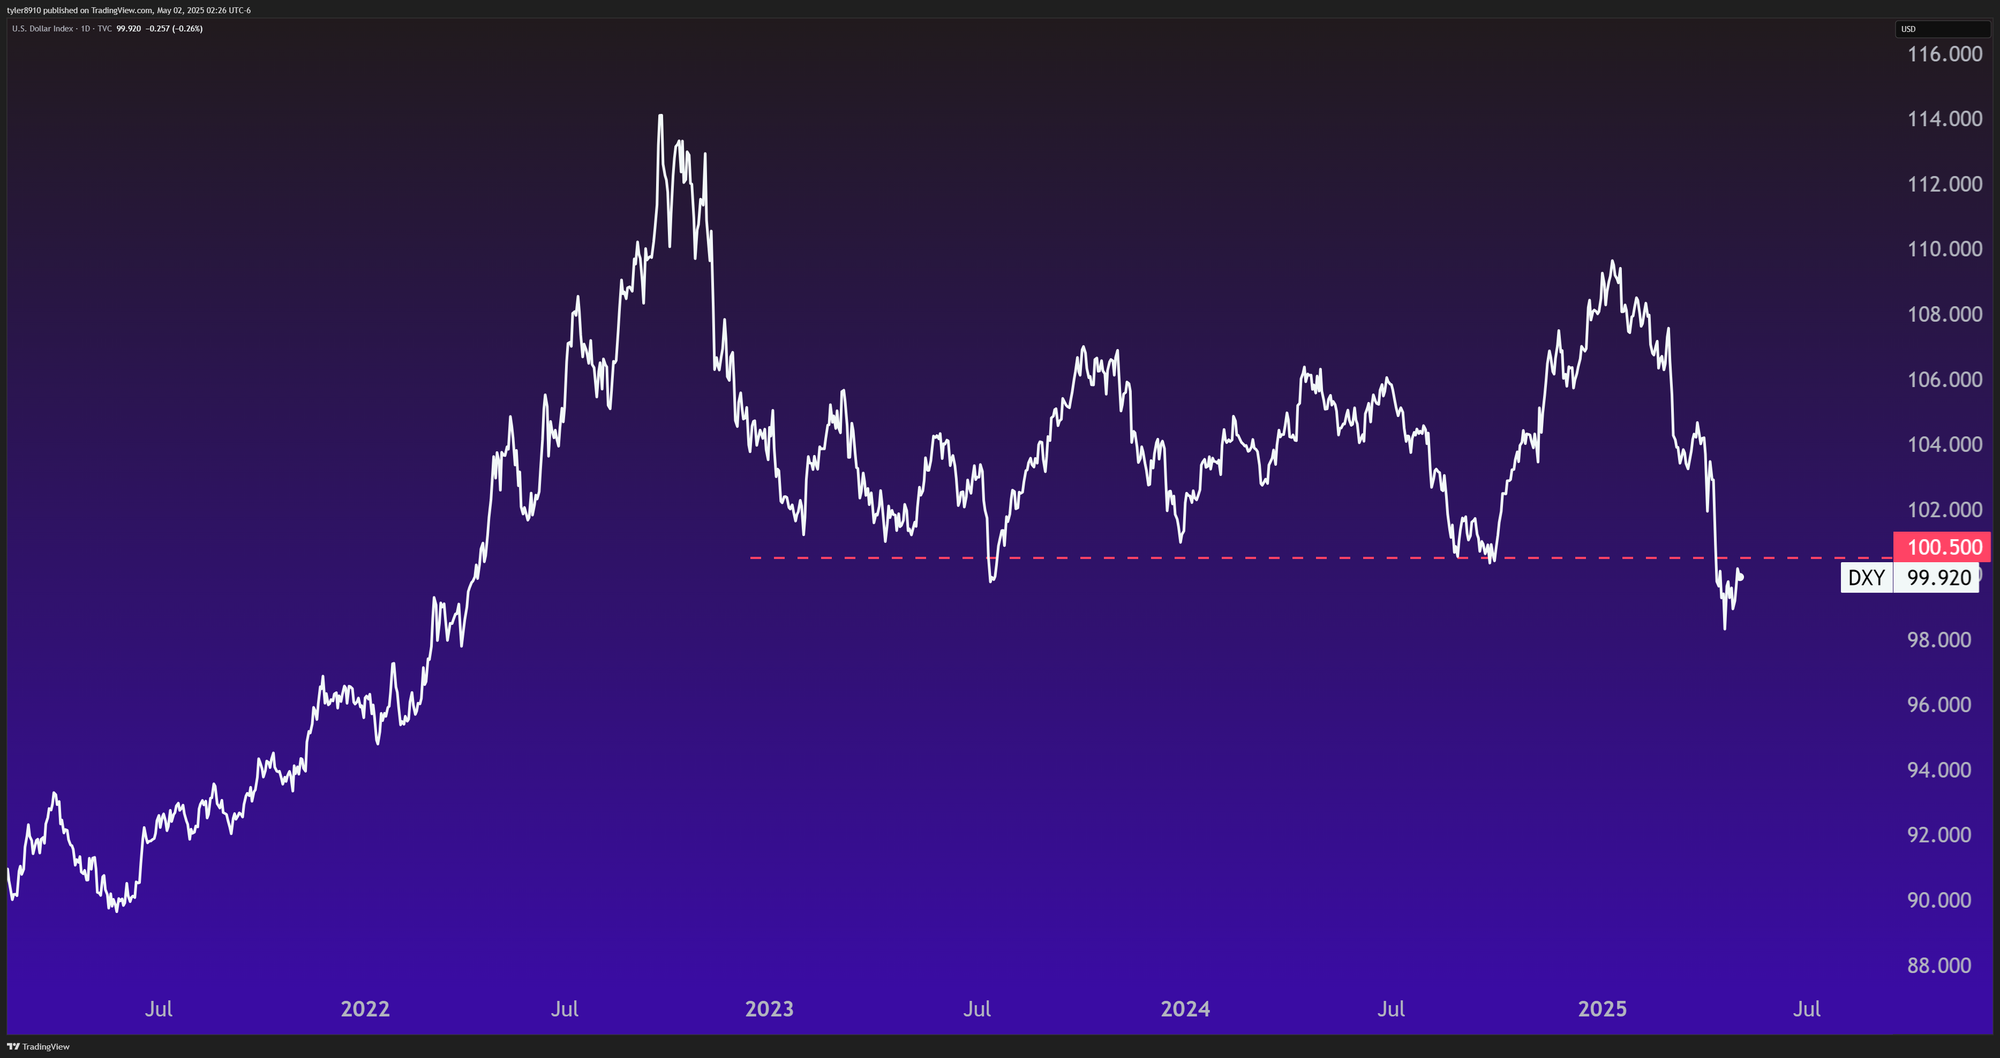
The dollar's recent weakness has caught many traders' attention, but let's zoom out for crucial context. Looking at the DXY chart from 2021 to now reveals it still trades within an elevated historical range, despite the sharp decline. Technical indicators suggest a near-term rebound, though the breach of the 100.5 support signals possible continued weakness on a longer horizon.
The portfolio strategy is well-equipped whether the dollar goes up or down. While currently heavy in T-bills, I can easily rotate into assets that may benefit from dollar weakness if needed. This flexibility is a significant advantage over traditional stock/bond portfolios.
May Allocations
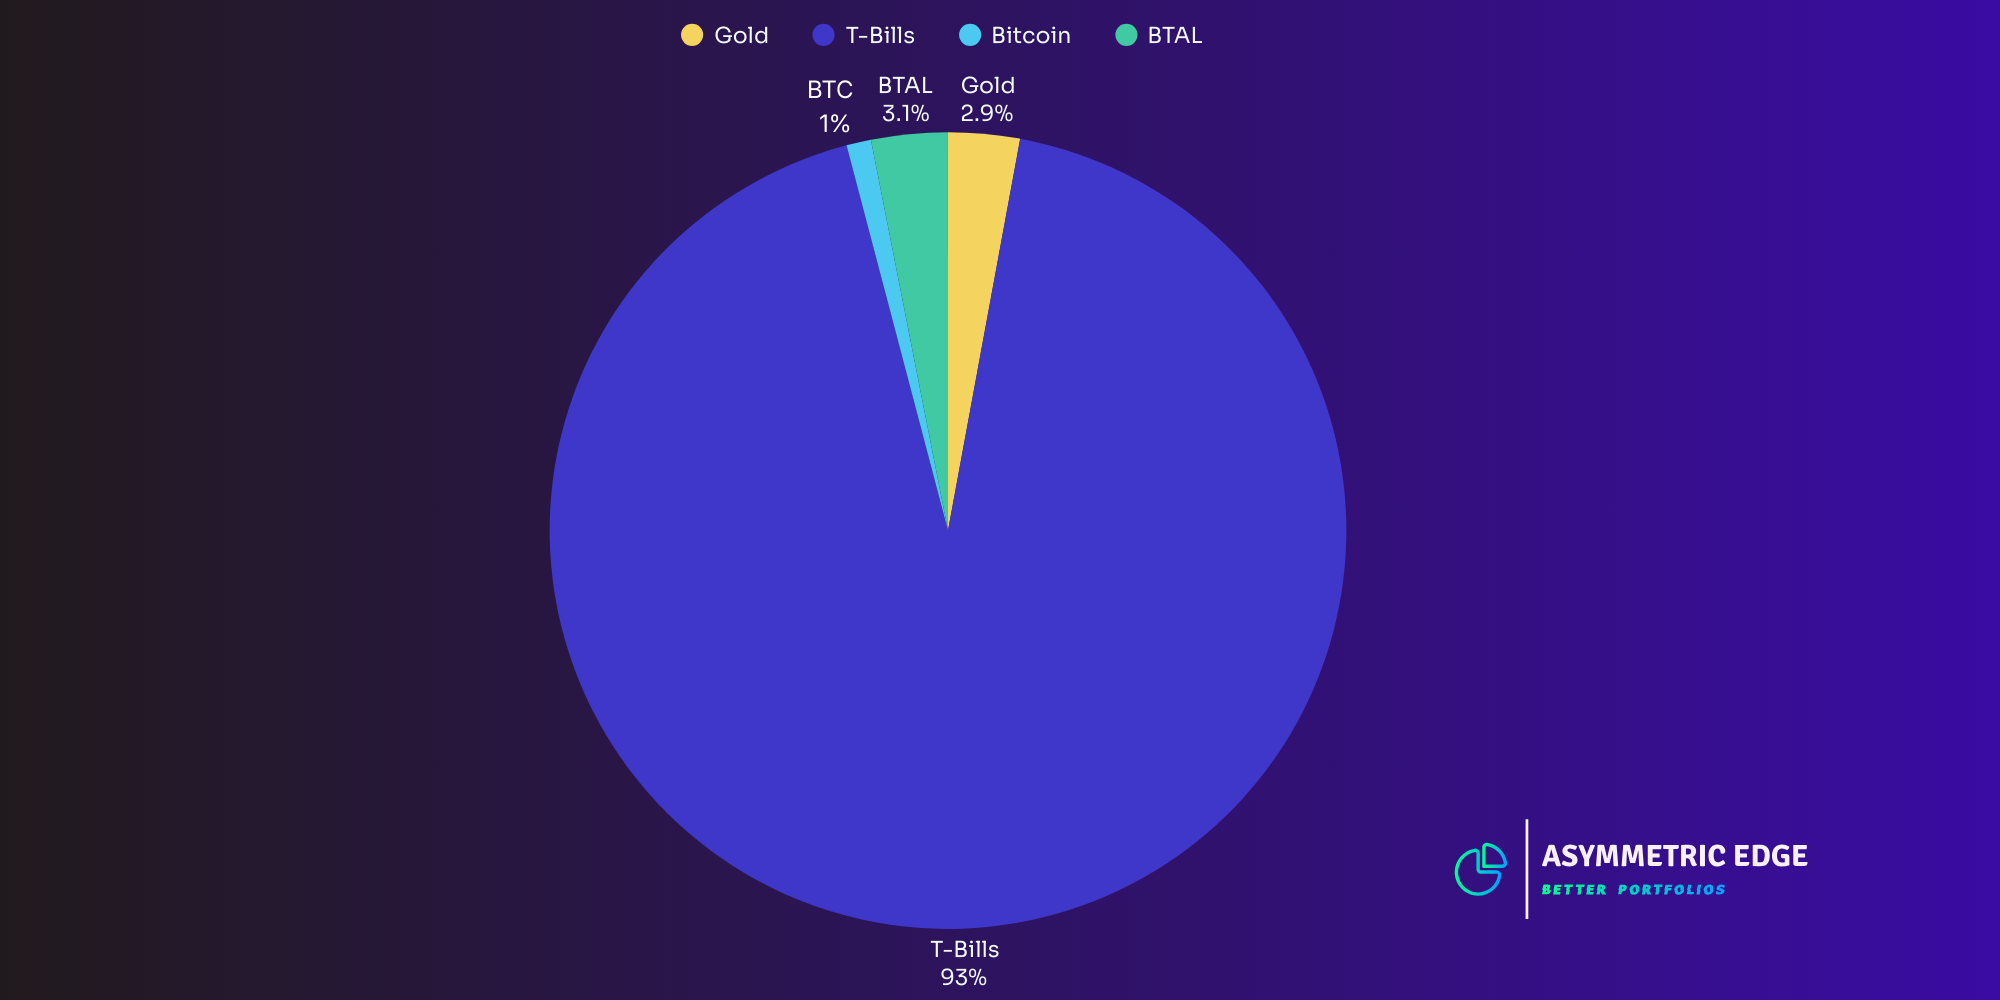
The portfolio remains defensively positioned, with minor adjustments from April.
- BIL: 93%
- BTAL: 3.1%
- GLD: 2.9%
- IBIT: 1%
Sitting mostly in cash may seem boring, but history shows patience matters more than ever when markets lack clear direction. As legendary investor Jim Rogers wisely noted:
One of the best rules anybody can learn about investing is to do nothing… until there is something to do.
Managing FOMO in a Volatile Market
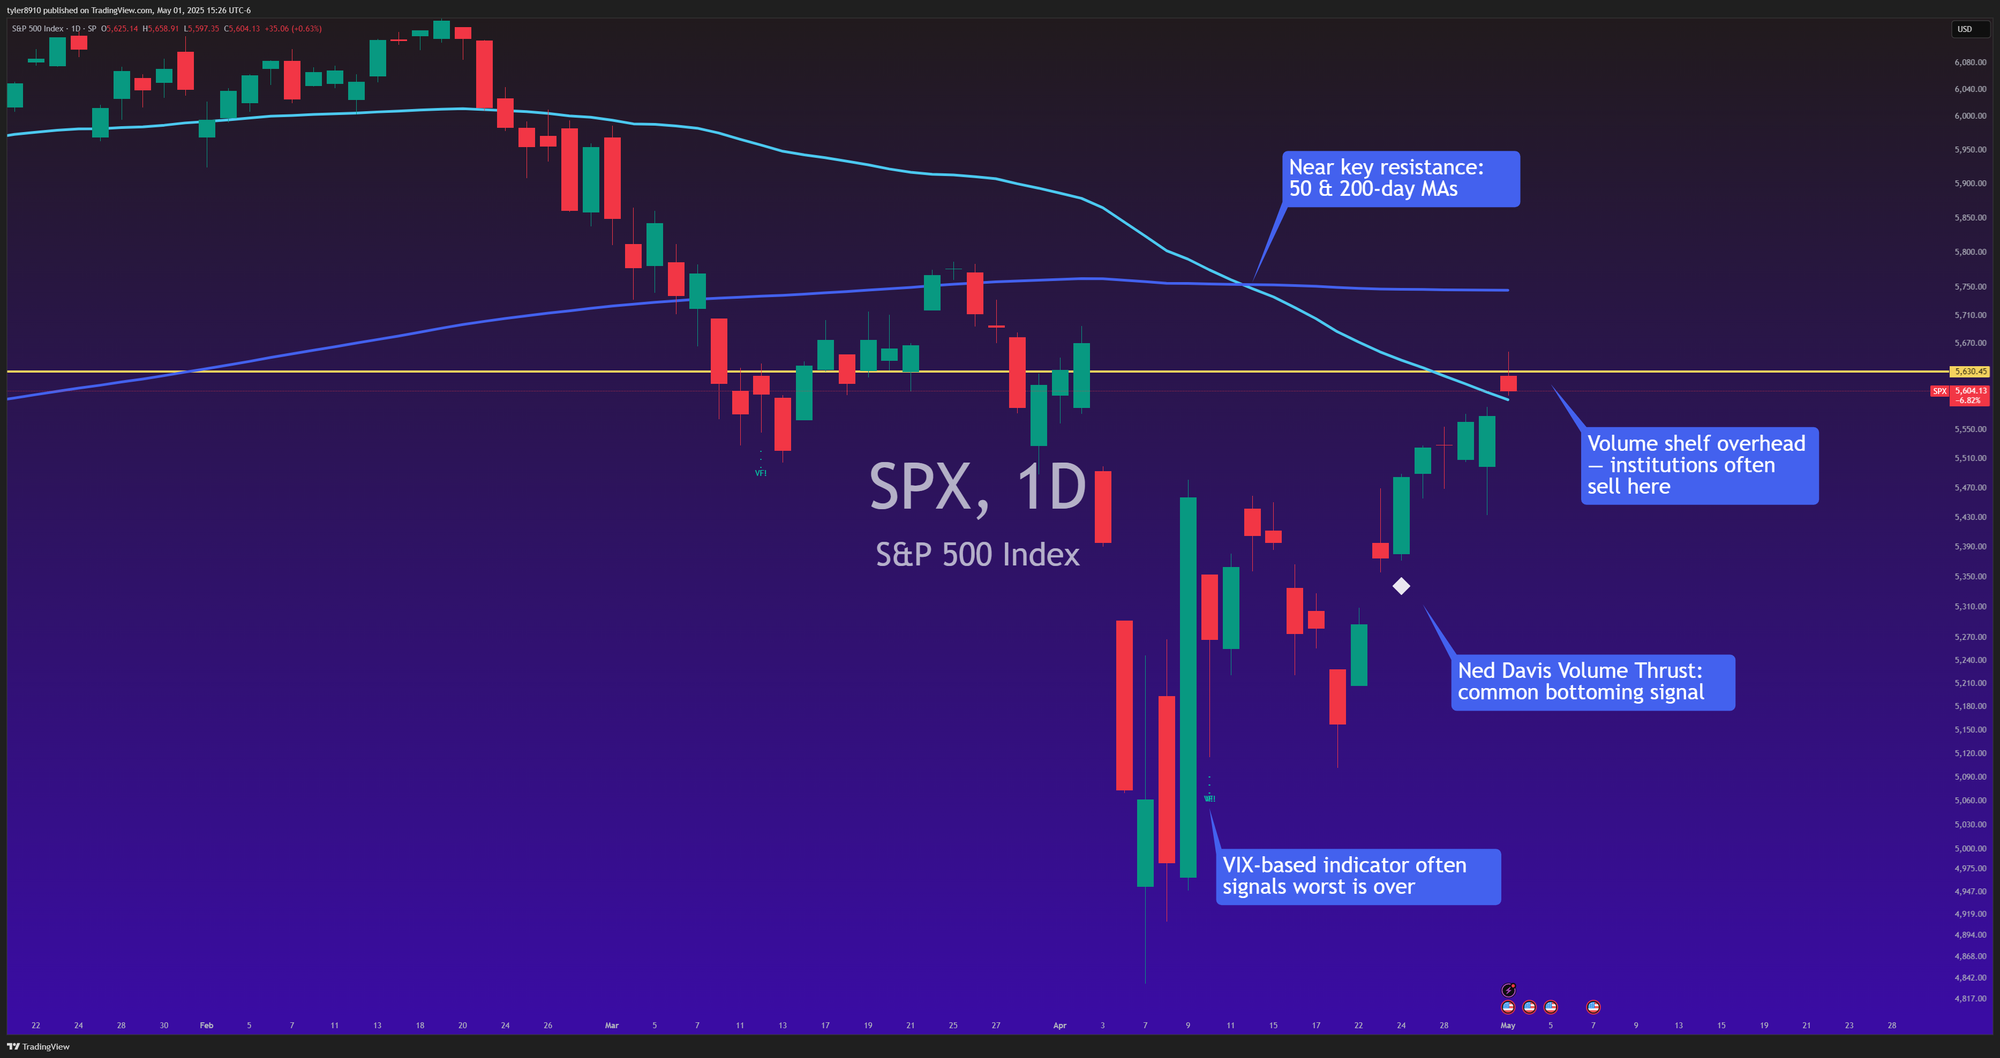
With the recent rebound in major indices, you might be wondering if you missed a buying opportunity. Let's examine the technical evidence and fight the Fear of Missing Out:
- The S&P 500's drawdown of -11.6% on April 7th was historically modest.
- The index is stalling at its 50-day Simple Moving Average (SMA).
- Prices remain well below the 200-day SMA (also negative).
- Heavy overhead volume suggests continued selling pressure from large market participants.
While some volatility indicators suggest near-term stabilization, the weight of technical evidence leans bearish. My observation: I anticipate choppy, sideways S&P 500 action in the coming weeks.
I designed my strategy to capture established trends when the likelihood of continuation is greatest. This approach helps me be more patient and reduce costly mistakes. I will be ready to re-enter risk-on assets when the odds appear to be more favorable.
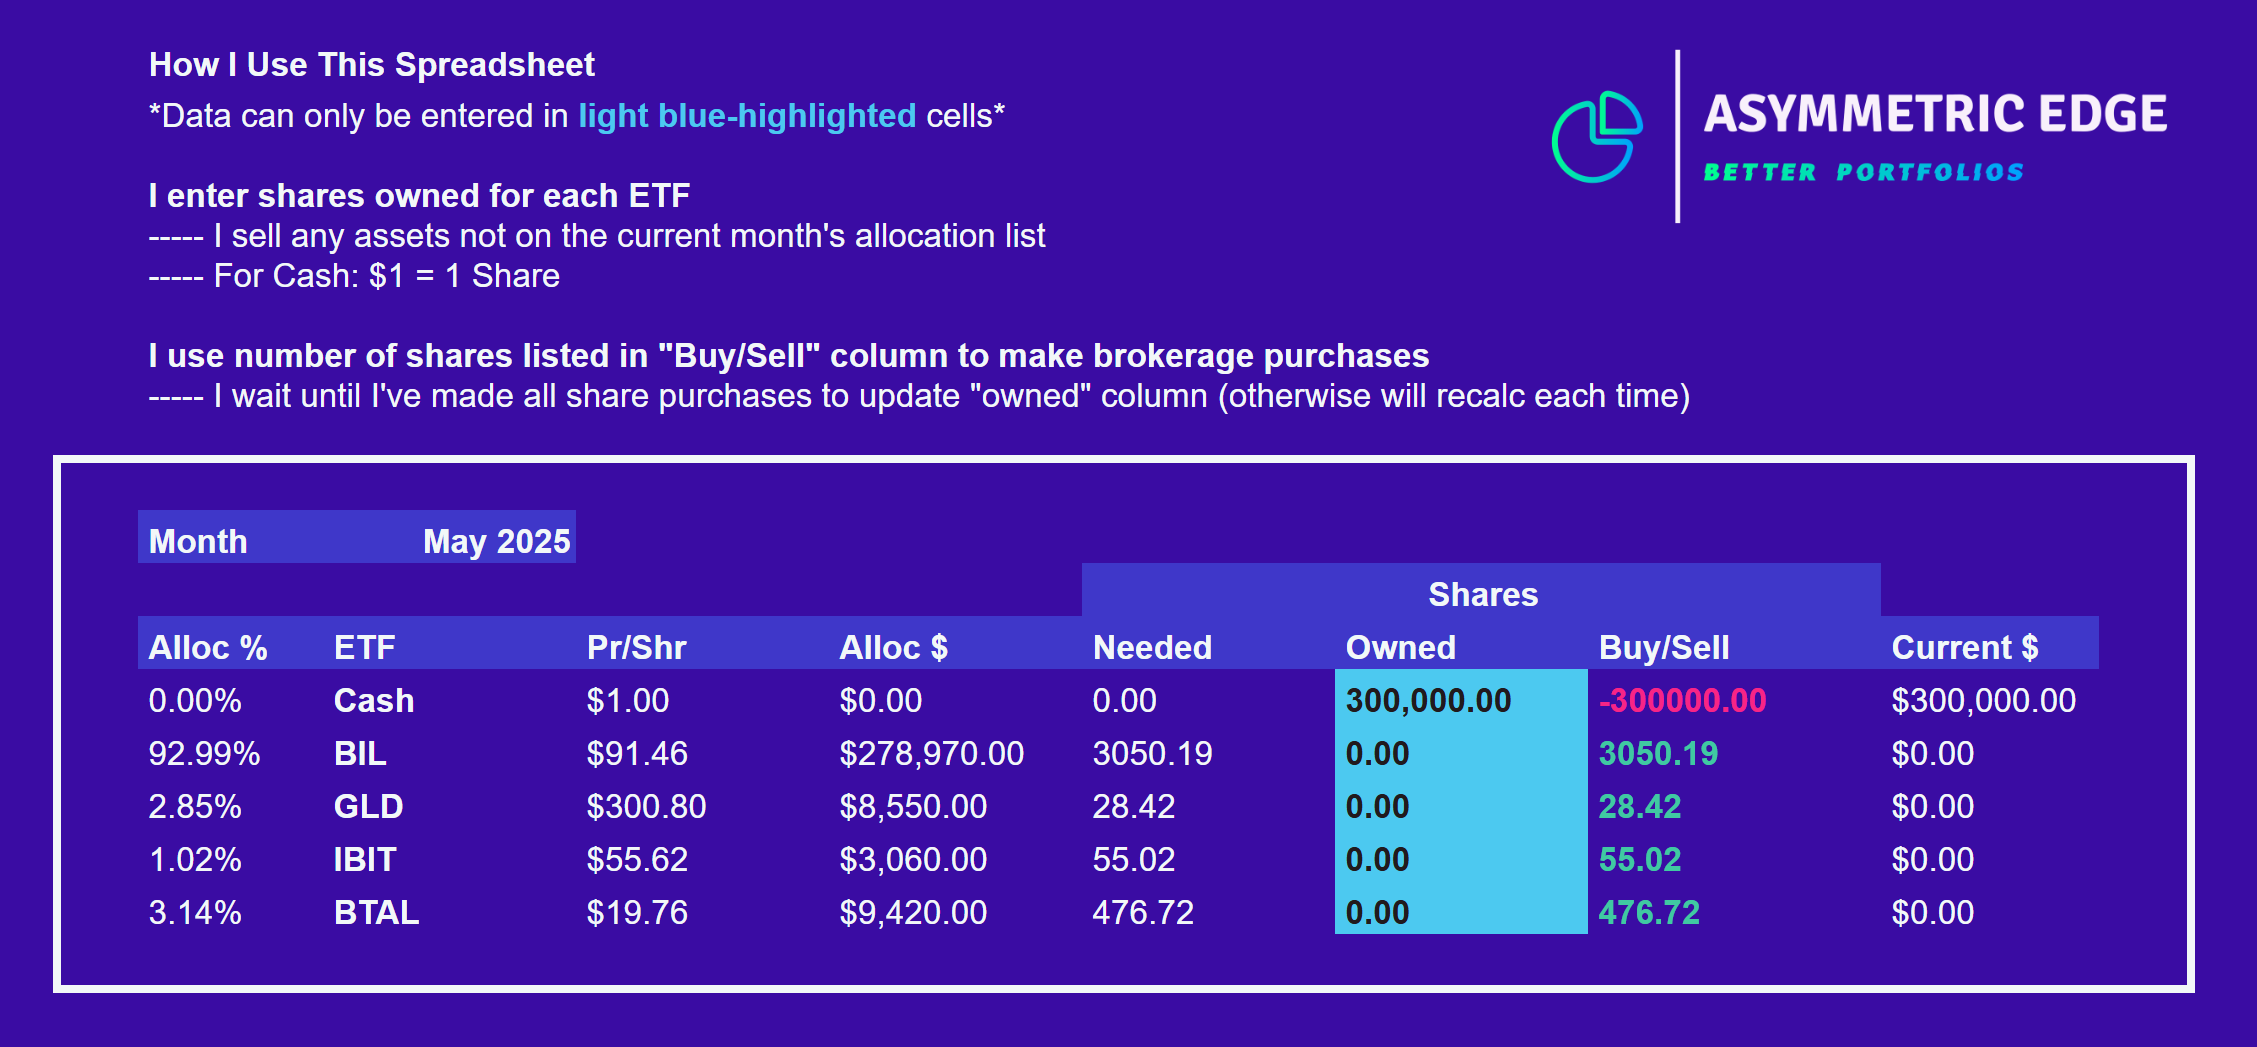
Purchasing Shares
I've created a Google Sheets calculator for portfolio rebalancing. The spreadsheet pulls live ETF prices and calculates how many shares to buy or sell based on the data provided.
Calculator Terms of Use
This tool is provided for informational purposes only. While I strive to ensure accuracy, I make no representation or warranty as to its accuracy or completeness. Users should verify all calculations independently.
This tool is especially helpful for:
- Quick rebalancing calculations during market hours.
- Ensuring accurate allocation percentages.
I use limit orders for less liquid ETFs like BTAL to avoid overpaying. Access the calculator here.
One Final Chart
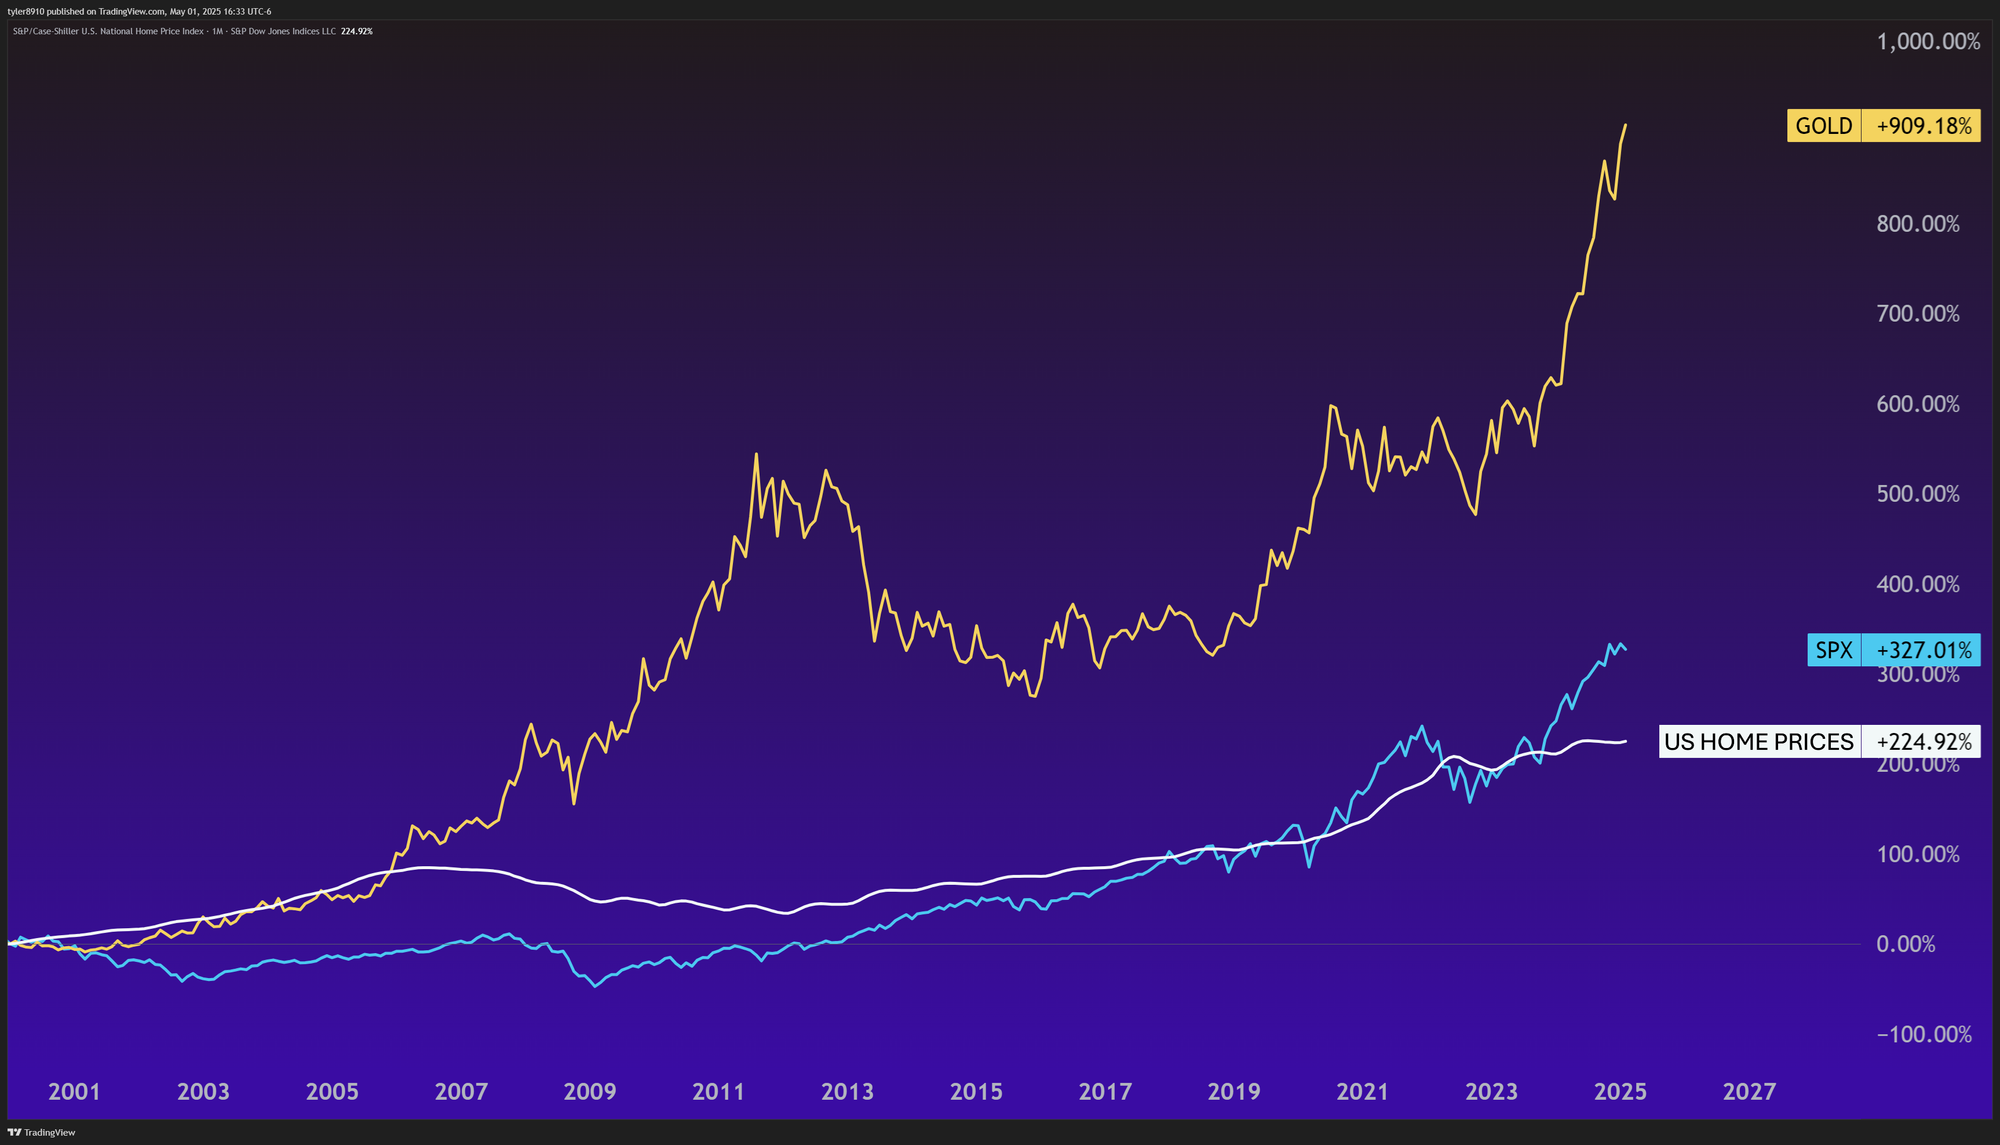
Comparing Real Estate, Gold, and Stocks
Here's a fascinating 25-year comparison of how three major investment classes (gold, house values, and the S&P 500) have performed. Real estate has helped many Americans build wealth, with home prices up 225% since 2000. The S&P 500 climbed 327% during this time, while gold soared an astounding 909%. These numbers show the potential value in diversifying beyond real estate.
A home serves two purposes: It's where you live and it's an investment. Real estate has been a solid wealth-builder, but its real value comes from having a place to call your own, build memories, and customize as you please, unlike pure investments like stocks or gold. The data suggests buying a home for the lifestyle and viewing any price appreciation as an added benefit.
This newsletter is for informational purposes only and should not be considered as investment advice or a recommendation of any particular security, strategy, or investment product. The information contained herein has been obtained from sources believed to be reliable, but its accuracy and completeness are not guaranteed. Opinions expressed are subject to change without notice. This material is not an offer to sell or a solicitation of an offer to buy any security.
The author may hold positions in securities mentioned in this newsletter. All expressions of opinion are subject to change without notice in reaction to shifting market conditions. Data contained herein from third-party providers is obtained from what are considered reliable sources. However, its accuracy, completeness, or reliability cannot be guaranteed.
Investment involves risk, including possible loss of principal. No investment strategy or risk management technique can guarantee returns or eliminate risk in any market environment.